This notebook is an exercise in the Intermediate Machine Learning course. You can reference the tutorial at this link.
In this exercise, you will leverage what you've learned to tune a machine learning model with cross-validation.
在本练习中,您将利用所学知识通过交叉验证调整机器学习模型。
Setup
设置
The questions below will give you feedback on your work. Run the following cell to set up the feedback system.
以下问题将为您提供有关您工作的反馈。 运行以下单元格来设置反馈系统。
# Set up code checking
import os
if not os.path.exists("../input/train.csv"):
    os.symlink("../input/home-data-for-ml-course/train.csv", "../input/train.csv")
    os.symlink("../input/home-data-for-ml-course/test.csv", "../input/test.csv")
from learntools.core import binder
binder.bind(globals())
from learntools.ml_intermediate.ex5 import *
print("Setup Complete")
Setup CompleteYou will work with the Housing Prices Competition for Kaggle Learn Users from the previous exercise.
您将参与上一个练习中的 Kaggle Learn 用户房价竞赛。

Run the next code cell without changes to load the training and test data in X and X_test. For simplicity, we drop categorical variables.
运行下一个代码单元而不进行任何更改,以加载X和X_test中的训练和测试数据。 为了简单起见,我们删除分类变量。
import pandas as pd
from sklearn.model_selection import train_test_split

# Read the data
train_data = pd.read_csv('../input/train.csv', index_col='Id')
test_data = pd.read_csv('../input/test.csv', index_col='Id')

# Remove rows with missing target, separate target from predictors
train_data.dropna(axis=0, subset=['SalePrice'], inplace=True)
y = train_data.SalePrice
train_data.drop(['SalePrice'], axis=1, inplace=True)

# Select numeric columns only
numeric_cols = [cname for cname in train_data.columns if train_data[cname].dtype in ['int64', 'float64']]
X = train_data[numeric_cols].copy()
X_test = test_data[numeric_cols].copy()
Use the next code cell to print the first several rows of the data.
使用下一个代码单元格打印数据的前几行。
X.head()| MSSubClass | LotFrontage | LotArea | OverallQual | OverallCond | YearBuilt | YearRemodAdd | MasVnrArea | BsmtFinSF1 | BsmtFinSF2 | ... | GarageArea | WoodDeckSF | OpenPorchSF | EnclosedPorch | 3SsnPorch | ScreenPorch | PoolArea | MiscVal | MoSold | YrSold | |
|---|---|---|---|---|---|---|---|---|---|---|---|---|---|---|---|---|---|---|---|---|---|
| Id | |||||||||||||||||||||
| 1 | 60 | 65.0 | 8450 | 7 | 5 | 2003 | 2003 | 196.0 | 706 | 0 | ... | 548 | 0 | 61 | 0 | 0 | 0 | 0 | 0 | 2 | 2008 |
| 2 | 20 | 80.0 | 9600 | 6 | 8 | 1976 | 1976 | 0.0 | 978 | 0 | ... | 460 | 298 | 0 | 0 | 0 | 0 | 0 | 0 | 5 | 2007 |
| 3 | 60 | 68.0 | 11250 | 7 | 5 | 2001 | 2002 | 162.0 | 486 | 0 | ... | 608 | 0 | 42 | 0 | 0 | 0 | 0 | 0 | 9 | 2008 |
| 4 | 70 | 60.0 | 9550 | 7 | 5 | 1915 | 1970 | 0.0 | 216 | 0 | ... | 642 | 0 | 35 | 272 | 0 | 0 | 0 | 0 | 2 | 2006 |
| 5 | 60 | 84.0 | 14260 | 8 | 5 | 2000 | 2000 | 350.0 | 655 | 0 | ... | 836 | 192 | 84 | 0 | 0 | 0 | 0 | 0 | 12 | 2008 |
5 rows × 36 columns
So far, you've learned how to build pipelines with scikit-learn. For instance, the pipeline below will use SimpleImputer() to replace missing values in the data, before using RandomForestRegressor() to train a random forest model to make predictions. We set the number of trees in the random forest model with the n_estimators parameter, and setting random_state ensures reproducibility.
到目前为止,您已经学习了如何使用 scikit-learn 构建管道。 例如,下面的管道将使用 SimpleImputer() 来替换数据中的缺失值,然后再使用 RandomForestRegressor() 训练随机森林模型进行预测。 我们使用n_estimators参数设置随机森林模型中的树数,并设置random_state确保可重复性。
from sklearn.ensemble import RandomForestRegressor
from sklearn.pipeline import Pipeline
from sklearn.impute import SimpleImputer

my_pipeline = Pipeline(steps=[
    ('preprocessor', SimpleImputer()),
    ('model', RandomForestRegressor(n_estimators=50, random_state=0))
])
You have also learned how to use pipelines in cross-validation. The code below uses the cross_val_score() function to obtain the mean absolute error (MAE), averaged across five different folds. Recall we set the number of folds with the cv parameter.
您还学习了如何在交叉验证中使用管道。 下面的代码使用 cross_val_score() 函数来获取平均绝对误差 (MAE), 五种不同的折叠。 回想一下,我们使用cv参数设置折叠次数。
from sklearn.model_selection import cross_val_score

# Multiply by -1 since sklearn calculates *negative* MAE
# 由于sklearn计算负的MAE,需要乘-1
scores = -1 * cross_val_score(my_pipeline, X, y,
                              cv=5,
                              scoring='neg_mean_absolute_error')

print("Average MAE score:", scores.mean())
Average MAE score: 18276.410356164386Step 1: Write a useful function
第 1 步:编写一个有用的函数
In this exercise, you'll use cross-validation to select parameters for a machine learning model.
在本练习中,您将使用交叉验证来选择机器学习模型的参数。
Begin by writing a function get_score() that reports the average (over three cross-validation folds) MAE of a machine learning pipeline that uses:
首先编写一个函数get_score(),报告机器学习管道的平均(超过三个交叉验证折叠)MAE,该管道使用:
- the data in
Xandyto create folds, - 用于创建折叠的
X和y中的数据, SimpleImputer()(with all parameters left as default) to replace missing values, andSimpleImputer()(所有参数保留为默认值)以替换缺失值,以及RandomForestRegressor()(withrandom_state=0) to fit a random forest model.RandomForestRegressor()(使用random_state=0)来拟合随机森林模型。
The n_estimators parameter supplied to get_score() is used when setting the number of trees in the random forest model.
在设置随机森林模型中的树数时,将使用提供给get_score()的n_estimators参数。
def get_score(n_estimators):
    my_pipeline = Pipeline(steps=[
        ('preprocessor', SimpleImputer()),
        ('model', RandomForestRegressor(n_estimators=n_estimators, random_state=0)),
    ])
    scores = -1 * cross_val_score(my_pipeline, X, y, cv=3, scoring='neg_mean_absolute_error')
    return scores.mean()
#def get_score(n_estimators):
#"""Return the average MAE over 3 CV folds of random forest model.
#Keyword argument:
#n_estimators -- the number of trees in the forest
#"""
# Replace this body with your own code
#pass
# Check your answer
step_1.check()Correct
# Lines below will give you a hint or solution code
# step_1.hint()
step_1.solution()
Solution:
def get_score(n_estimators):
    my_pipeline = Pipeline(steps=[
        ('preprocessor', SimpleImputer()),
        ('model', RandomForestRegressor(n_estimators, random_state=0))
    ])
    scores = -1 * cross_val_score(my_pipeline, X, y,
                                  cv=3,
                                  scoring='neg_mean_absolute_error')
    return scores.mean()
Step 2: Test different parameter values
步骤2:测试不同的参数值
Now, you will use the function that you defined in Step 1 to evaluate the model performance corresponding to eight different values for the number of trees in the random forest: 50, 100, 150, ..., 300, 350, 400.
现在,您将使用在步骤 1 中定义的函数来评估与随机森林中树木数量的八个不同值相对应的模型性能:50、100、150、...、300、350、400。
Store your results in a Python dictionary results, where results[i] is the average MAE returned by get_score(i).
将结果存储在 Python 字典results中,其中results[i]是get_score(i)返回的平均 MAE。
#results = ____ # Your code here
results = {}
for i in range(50, 401, 50):
    results[i] = get_score(i)

# Check your answer
step_2.check()
Correct
# Lines below will give you a hint or solution code
# step_2.hint()
step_2.solution()
Solution:
results = {}
for i in range(1,9):
    results[50*i] = get_score(50*i)
Use the next cell to visualize your results from Step 2. Run the code without changes.
使用下一个单元格可视化步骤 2 中的结果。运行代码而不进行任何更改。
import matplotlib.pyplot as plt
%matplotlib inline

plt.plot(list(results.keys()), list(results.values()))
plt.show()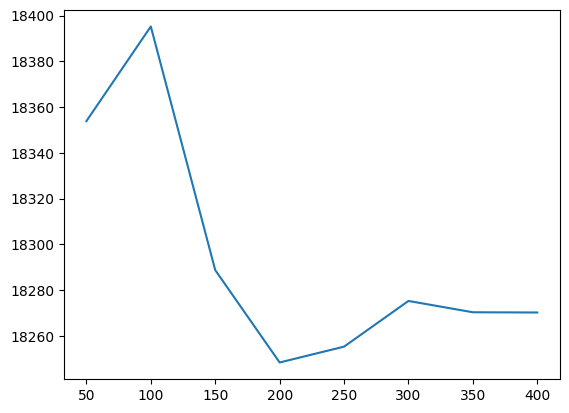
Step 3: Find the best parameter value
第三步:找到最佳参数值
Given the results, which value for n_estimators seems best for the random forest model? Use your answer to set the value of n_estimators_best.
根据结果,n_estimators的哪个值最适合随机森林模型? 使用您的答案来设置n_estimators_best的值。
n_estimators_best = 200

# Check your answer
step_3.check()
Correct
# Lines below will give you a hint or solution code
# step_3.hint()
step_3.solution()
Solution:
n_estimators_best = min(results, key=results.get)In this exercise, you have explored one method for choosing appropriate parameters in a machine learning model.
在本练习中,您探索了一种在机器学习模型中选择适当参数的方法。
If you'd like to learn more about hyperparameter optimization, you're encouraged to start with grid search, which is a straightforward method for determining the best combination of parameters for a machine learning model. Thankfully, scikit-learn also contains a built-in function GridSearchCV() that can make your grid search code very efficient!
如果您想了解有关超参数优化 的更多信息,建议您从网格搜索开始,这是一种确定机器学习模型的最佳超参数组合的简单方法 。 值得庆幸的是,scikit-learn 还包含一个内置函数 GridSearchCV(),可以让你的网格搜索 代码非常高效!
Keep going
继续前进
Continue to learn about gradient boosting, a powerful technique that achieves state-of-the-art results on a variety of datasets.
继续了解梯度提升,这是一种强大的技术,可以在各种数据集上实现最先进的结果。