This notebook is an exercise in the Data Visualization course. You can reference the tutorial at this link.
In this exercise, you will write your first lines of code and learn how to use the coding environment for the course!
在本练习中,您将编写第一行代码并学习如何使用课程的编码环境!
Setup
设置
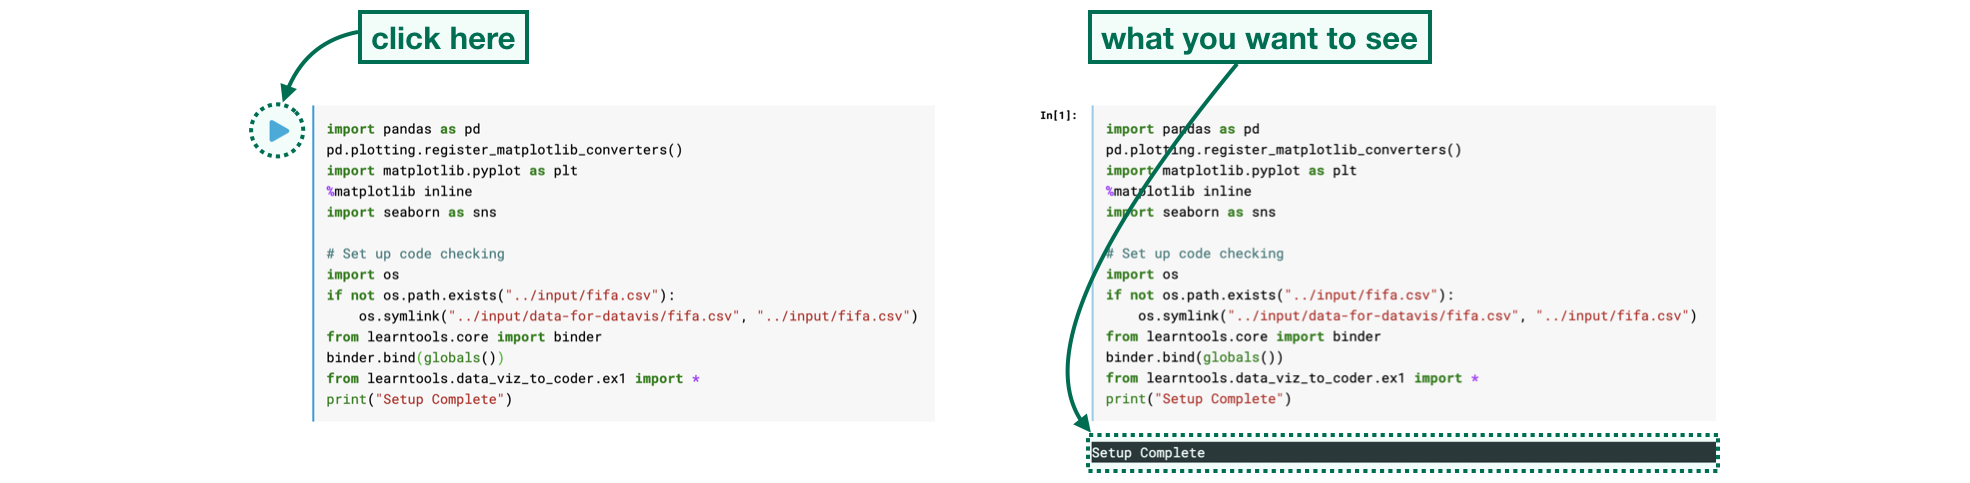
First, you'll learn how to run code, and we'll start with the code cell below. (Remember that a code cell in a notebook is just a gray box containing code that we'd like to run.)
首先,您将学习如何运行代码,我们将从下面的代码单元开始。 (请记住,笔记本中的代码单元只是一个灰色框,其中包含我们要运行的代码。)
- Begin by clicking inside the code cell.
- 首先单击代码单元格内部。
- Click on the blue triangle (in the shape of a "Play button") that appears to the left of the code cell.
- 单击出现在代码单元左侧的蓝色三角形(
播放按钮形状)。 - If your code was run sucessfully, you will see
Setup Completeas output below the cell. - 如果您的代码成功运行,您将在单元格下方看到
设置完成输出。
The code cell below imports and configures the Python libraries that you need to complete the exercise.
下面的代码单元导入并配置完成练习所需的 Python 库。
Click on the cell and run it.
单击单元格并运行它。
import pandas as pd
pd.plotting.register_matplotlib_converters()
import matplotlib.pyplot as plt
%matplotlib inline
import seaborn as sns

# Set up code checking
import os
if not os.path.exists("../input/fifa.csv"):
    os.symlink("../input/data-for-datavis/fifa.csv", "../input/fifa.csv")
from learntools.core import binder
binder.bind(globals())
from learntools.data_viz_to_coder.ex1 import *
print("Setup Complete")
Setup CompleteThe code you just ran sets up the system to give you feedback on your work. You'll learn more about the feedback system in the next step.
您刚刚运行的代码会设置系统为您提供工作反馈。 您将在下一步中了解有关反馈系统的更多信息。
Step 1: Explore the feedback system
第 1 步:探索反馈系统
Each exercise lets you test your new skills with a real-world dataset. Along the way, you'll receive feedback on your work. You'll see if your answer is right, get customized hints, and see the official solution (if you'd like to take a look!).
每个练习都可以让您使用真实数据集测试您的新技能。 在此过程中,您将收到有关您工作的反馈。 您将看到您的答案是否正确,获得自定义提示,并查看官方解决方案(如果您想看一下!)。
To explore the feedback system, we'll start with a simple example of a coding problem. Follow the following steps in order:
为了探索反馈系统,我们将从一个简单的编码问题示例开始。 按顺序执行以下步骤:
-
Run the code cell below without making any edits. It will show the following output:
Check: When you've updated the starter code,
check()will tell you whether your code is correct. You need to update the code that creates variableoneThis means you need to change the code to set the variable
oneto something other than the blank provided below (____). -
运行下面的代码单元而不进行任何编辑。 它将显示以下输出:
检查:当您更新起始代码时,
check()会告诉您代码是否正确。 您需要更新创建变量one的代码这意味着您需要更改代码以将变量
one设置为除下面提供的空白(____)之外的其他值。 -
Replace the underline with a
2, so that the line of code appears asone = 2. Then, run the code cell. This should return the following output:Incorrect: Incorrect value for
one:2This means we still have the wrong answer to the question.
-
将下划线替换为
2,使该行代码显示为one = 2。 然后,运行代码单元。 这应该返回以下输出:不正确:
one的值不正确:2这意味着我们对问题的答案仍然是错误的。
-
Now, change the
2to1, so that the line of code appears asone = 1. Then, run the code cell. The answer should be marked as Correct. You have now completed this problem! -
现在,将
2更改为1,以便该代码行显示为one = 1。 然后,运行代码单元。 答案应标记为正确。 现在你已经完成了这个问题!
# Fill in the line below
one = ____

# Check your answer
step_1.check()
Check: When you've updated the starter code, check() will tell you whether your code is correct. You need to update the code that creates variable one
# Fill in the line below
#one = ____
one = 2
# Check your answer
step_1.check()
Incorrect: Incorrect value for one: 2
# Fill in the line below
#one = ____
one = 1
# Check your answer
step_1.check()
Correct
In this exercise, you were responsible for filling in the line of code that sets the value of variable one. Don't edit the code that checks your answer. You'll need to run the lines of code like step_1.check() and step_2.check() just as they are provided.
在本练习中,您负责填写设置变量one值的代码行。 不要编辑检查答案的代码。 您需要按照提供的方式运行step_1.check()和step_2.check()等代码行。
This problem was relatively straightforward, but for more difficult problems, you may like to receive a hint or view the official solution. Run the code cell below now to receive both for this problem.
这个问题相对简单,但是对于更困难的问题,您可能希望收到提示或查看官方解决方案。 现在运行下面的代码单元以接收此问题的两个信息。
step_1.hint()
step_1.solution()
Hint: How many moons does Earth have?
Solution:
one = 1Step 2: Load the data
第 2 步:加载数据
You are ready to get started with some data visualization! You'll begin by loading the dataset from the previous tutorial.
您已准备好开始进行一些数据可视化! 您将首先加载上一教程中的数据集。
The code you need is already provided in the cell below. Just run that cell. If it shows Correct result, you're ready to move on!
您需要的代码已在下面的单元格中提供。 只需运行该单元即可。 如果显示正确结果,您就可以继续前进了!
# Path of the file to read
fifa_filepath = "../input/fifa.csv"

# Read the file into a variable fifa_data
fifa_data = pd.read_csv(fifa_filepath, index_col="Date", parse_dates=True)

# Check your answer
step_2.check()
Correct
Next, recall the difference between comments and executable code:
接下来回忆一下注释和可执行代码之间的区别:
- Comments are preceded by a pound sign (
#) and contain text that appear faded and italicized. They are completely ignored by the computer when the code is run. - 注释 前面有井号 (
#),并且包含淡化和斜体的文本。 当代码运行时,它们被计算机完全忽略。 - Executable code is code that is run by the computer.
- 可执行代码是由计算机运行的代码。
In the code cell below, every line is a comment:
在下面的代码单元中,每一行都是注释:
# Uncomment the line below to receive a hint
#step_2.hint()
#step_2.solution()
If you run the code cell below without making any changes, it won't return any output. Try this now!
如果您运行下面的代码单元而不进行任何更改,它将不会返回任何输出。 现在就试试这个吧!
# Uncomment the line below to receive a hint
step_2.hint()
# Uncomment the line below to see the solution
step_2.solution()
Hint: Use pd.read_csv, and follow it with three pieces of text that are enclosed in parentheses and separated by commas. (1) The filepath for the dataset is provided in fifa_filepath. (2) Use the "Date" column to label the rows. (3) Make sure that the row labels are recognized as dates.
Solution:
fifa_data = pd.read_csv(fifa_filepath, index_col="Date", parse_dates=True)Next, remove the pound sign before step_2.hint() so that the code cell above appears as follows:
接下来,删除step_2.hint()之前的井号,以便上面的代码单元格显示如下:
# Uncomment the line below to receive a hint
step_2.hint()
#step_2.solution()
When we remove the pound sign before a line of code, we say we uncomment the line. This turns the comment into a line of executable code that is run by the computer. Run the code cell now, which should return the Hint as output.
当我们删除一行代码之前的井号时,我们说我们取消注释该行。 这会将注释变成一行由计算机运行的可执行代码。 现在运行代码单元,它应该返回 Hint 作为输出。
Finally, uncomment the line to see the solution, so the code cell appears as follows:
最后,取消注释该行以查看解决方案,因此代码单元格显示如下:
# Uncomment the line below to receive a hint
step_2.hint()
step_2.solution()
Then, run the code cell. You should receive both a Hint and the Solution.
然后,运行代码单元。 您应该会收到提示和解决方案。
If at any point you're having trouble with coming up with the correct answer to a problem, you are welcome to obtain either a hint or the solution before completing the cell. (So, you don't need to get a Correct result before running the code that gives you a Hint or the Solution.)
如果您在任何时候无法找到问题的正确答案,欢迎您在完成单元格之前获得提示或解决方案。 (因此,在运行为您提供提示或 解决方案。)
Step 3: Plot the data
步骤 3:绘制数据
Now that the data is loaded into the notebook, you're ready to visualize it!
现在数据已加载到笔记本中,您可以将其可视化!
Run the next code cell without changes to make a line chart. The code may not make sense yet - you'll learn all about it in the next tutorial!
运行下一个代码单元而不进行任何更改以制作折线图。 该代码可能还没有意义 - 您将在下一个教程中了解它的所有内容!
pd.option_context('mode.use_inf_as_na', True)
# Set the width and height of the figure
plt.figure(figsize=(16,6))
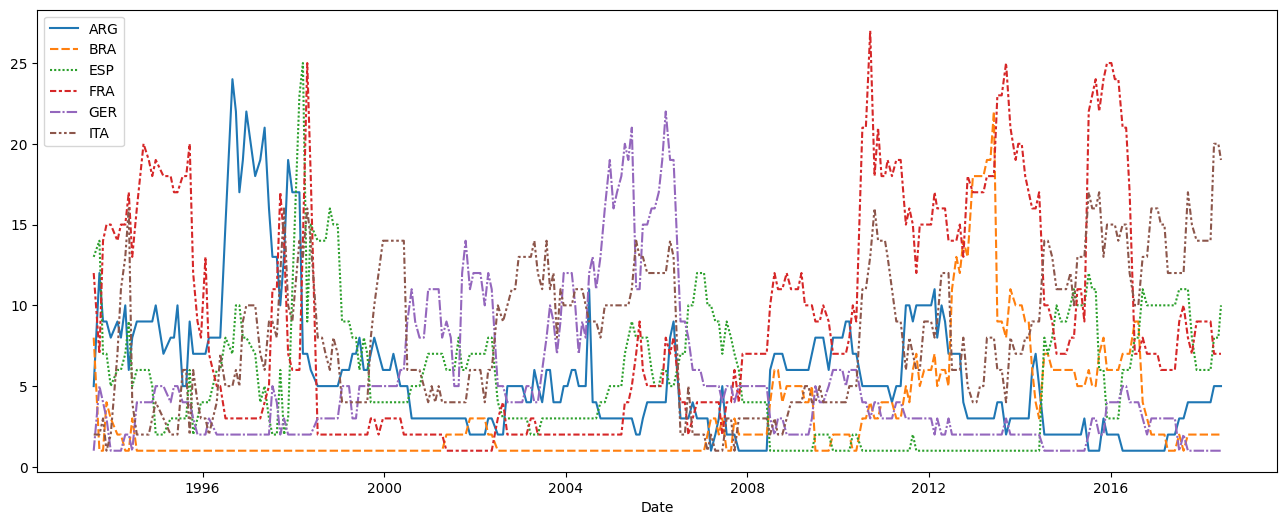
# Line chart showing how FIFA rankings evolved over time
sns.lineplot(data=fifa_data)
# Check your answer
step_3.a.check()/opt/conda/lib/python3.10/site-packages/seaborn/_oldcore.py:1119: FutureWarning: use_inf_as_na option is deprecated and will be removed in a future version. Convert inf values to NaN before operating instead.
with pd.option_context('mode.use_inf_as_na', True):
/opt/conda/lib/python3.10/site-packages/seaborn/_oldcore.py:1119: FutureWarning: use_inf_as_na option is deprecated and will be removed in a future version. Convert inf values to NaN before operating instead.
with pd.option_context('mode.use_inf_as_na', True):Correct
Some questions won't require you to write any code. Instead, you'll interpret visualizations.
有些问题不需要您编写任何代码。 相反,您将理解可视化。
As an example, consider the question: Considering only the years represented in the dataset, which countries spent at least 5 consecutive years in the #1 ranked spot?
举个例子,考虑这个问题:仅考虑数据集中代表的年份,哪些国家/地区至少连续 5 年排名第一?
To receive a Hint, uncomment the line below, and run the code cell.
要接收提示,请取消注释下面的行,然后运行代码单元格。
step_3.b.hint()Hint: Which lines stay at least five consecutive years at the bottom of the chart?
Once you have an answer, check the Solution to get credit for completing the problem and to ensure your interpretation is right.
获得答案后,请检查解决方案以获得完成问题的奖励并确保您的解释正确。
# Check your answer (Run this code cell to receive credit!)
step_3.b.solution()
Solution: The only country that meets this criterion is Brazil (code: BRA), as it maintains the highest ranking in 1996-2000. Other countries do spend some time in the number 1 spot, but Brazil is the only country that maintains it for at least five consecutive years.
Congratulations - you have completed your first coding exercise!
恭喜 - 您已经完成了第一个编码练习!
Keep going
继续前进
Move on to learn to create your own line charts with a new dataset.
继续学习使用新数据集创建您自己的折线图。