This notebook is an exercise in the Data Visualization course. You can reference the tutorial at this link.
In this exercise, you will use your new knowledge to propose a solution to a real-world scenario. To succeed, you will need to import data into Python, answer questions using the data, and generate line charts to understand patterns in the data.
在本练习中,您将使用新知识提出现实场景的解决方案。 为了成功,您需要将数据导入 Python,使用数据回答问题,并生成 折线图 以了解数据中的模式。
Scenario
场景
You have recently been hired to manage the museums in the City of Los Angeles. Your first project focuses on the four museums pictured in the images below.
您最近受聘管理洛杉矶市的博物馆。 您的第一个项目重点关注下图中所示的四个博物馆。

You will leverage data from the Los Angeles Data Portal that tracks monthly visitors to each museum.
您将利用来自洛杉矶数据门户 的数据来跟踪每个博物馆的每月访客量。

Setup
设置
Run the next cell to import and configure the Python libraries that you need to complete the exercise.
运行下一个单元以导入和配置完成练习所需的 Python 库。
import pandas as pd
pd.plotting.register_matplotlib_converters()
import matplotlib.pyplot as plt
%matplotlib inline
import seaborn as sns
print("Setup Complete")
Setup CompleteThe questions below will give you feedback on your work. Run the following cell to set up the feedback system.
以下问题将为您提供有关您工作的反馈。 运行以下单元格来设置反馈系统。
# Set up code checking
import os
if not os.path.exists("../input/museum_visitors.csv"):
    os.symlink("../input/data-for-datavis/museum_visitors.csv", "../input/museum_visitors.csv")
from learntools.core import binder
binder.bind(globals())
from learntools.data_viz_to_coder.ex2 import *
print("Setup Complete")
Setup CompleteStep 1: Load the data
第 1 步:加载数据
Your first assignment is to read the LA Museum Visitors data file into museum_data. Note that:
您的第一个任务是将洛杉矶博物馆游客数据文件读入museum_data。 注意:
- The filepath to the dataset is stored as
museum_filepath. Please do not change the provided value of the filepath. - 数据集的文件路径存储为
museum_filepath。 请不要更改提供的文件路径值。 - The name of the column to use as row labels is
"Date". (This can be seen in cell A1 when the file is opened in Excel.) - 用作行标签的列的名称是
Date。 (在 Excel 中打开文件时,可以在单元格 A1 中看到这一点。)
To help with this, you may find it useful to revisit some relevant code from the tutorial, which we have pasted below:
为了帮助解决此问题,您可能会发现重新访问教程中的一些相关代码很有用,我们将其粘贴在下面:
# Path of the file to read
spotify_filepath = "../input/spotify.csv"

# Read the file into a variable spotify_data
spotify_data = pd.read_csv(spotify_filepath, index_col="Date", parse_dates=True)
The code you need to write now looks very similar!
您现在需要编写的代码看起来非常相似!
# Path of the file to read
museum_filepath = "../input/museum_visitors.csv"

# Fill in the line below to read the file into a variable museum_data
# museum_data = ____
museum_data = pd.read_csv(museum_filepath, index_col="Date", parse_dates=True)
# Run the line below with no changes to check that you've loaded the data correctly
step_1.check()
Correct
# Uncomment the line below to receive a hint
#step_1.hint()
# Uncomment the line below to see the solution
step_1.solution()
Solution:
museum_data = pd.read_csv(museum_filepath, index_col="Date", parse_dates=True)Step 2: Review the data
第 2 步:查看数据
Use a Python command to print the last 5 rows of the data.
使用 Python 命令打印最后 5 行数据。
# Print the last five rows of the data
#____ # Your code here

museum_data.tail()| Avila Adobe | Firehouse Museum | Chinese American Museum | America Tropical Interpretive Center | |
|---|---|---|---|---|
| Date | ||||
| 2018-07-01 | 23136 | 4191 | 2620 | 4718 |
| 2018-08-01 | 20815 | 4866 | 2409 | 3891 |
| 2018-09-01 | 21020 | 4956 | 2146 | 3180 |
| 2018-10-01 | 19280 | 4622 | 2364 | 3775 |
| 2018-11-01 | 17163 | 4082 | 2385 | 4562 |
The last row (for 2018-11-01) tracks the number of visitors to each museum in November 2018, the next-to-last row (for 2018-10-01) tracks the number of visitors to each museum in October 2018, and so on.
最后一行(2018-11-01)跟踪 2018 年 11 月每个博物馆的参观人数,倒数第二行(2018-10-01)跟踪每个博物馆的参观人数 2018 年 10 月,等等。
Use the last 5 rows of the data to answer the questions below.
使用最后 5 行数据回答以下问题。
# Fill in the line below: How many visitors did the Chinese American Museum
# receive in July 2018?
#ca_museum_jul18 = ____

# ca_museum_jul18 = 2620

ca_museum_jul18 = museum_data.loc['2018-07-01','Chinese American Museum']

# Fill in the line below: In October 2018, how many more visitors did Avila
# Adobe receive than the Firehouse Museum?
#avila_oct18 = ____
# avila_oct18 = 19280-4622
avila_oct18 = museum_data.loc['2018-10-01','Avila Adobe'] - museum_data.loc['2018-10-01','Firehouse Museum']
# Check your answers
step_2.check()
Correct
# Lines below will give you a hint or solution code
# step_2.hint()
step_2.solution()
Solution:
# Print the last five rows of the data
museum_data.tail()
# How many visitors did the Chinese American Museum
# receive in July 2018?
ca_museum_jul18 = 2620
# In October 2018, how many more visitors did Avila
# Adobe receive than the Firehouse Museum?
avila_oct18 = 14658
Step 3: Convince the museum board
步骤 3:说服博物馆董事会
The Firehouse Museum claims they ran an event in 2014 that brought an incredible number of visitors, and that they should get extra budget to run a similar event again. The other museums think these types of events aren't that important, and budgets should be split purely based on recent visitors on an average day.
消防站博物馆声称他们在 2014 年举办了一次活动,吸引了数量惊人的游客,他们应该获得额外的预算来再次举办类似的活动。 其他博物馆认为这些类型的活动并不那么重要,预算应该完全根据平均每天的最近参观者来分配。
To show the museum board how the event compared to regular traffic at each museum, create a line chart that shows how the number of visitors to each museum evolved over time. Your figure should have four lines (one for each museum).
为了向博物馆看板展示该活动与每个博物馆的常规流量相比的情况,请创建一个折线图,显示每个博物馆的游客数量随时间的变化情况。 你的人物应该有四行(每个博物馆一条)。
(Optional) Note: If you have some prior experience with plotting figures in Python, you might be familiar with the
plt.show()command. If you decide to use this command, please place it after the line of code that checks your answer (in this case, place it afterstep_3.check()below) -- otherwise, the checking code will return an error!(可选)注意:如果您之前有一些在 Python 中绘制图形的经验,您可能会熟悉
plt.show()命令。 如果您决定使用此命令,请将其放在检查答案的代码行之后(在本例中,将其放在下面的step_3.check()之后)——否则,检查代码将返回 一个错误!
# Line chart showing the number of visitors to each museum over time
#____ # Your code here
plt.figure(figsize=(16,9))
sns.lineplot(data=museum_data)
# Check your answer
step_3.check()
/opt/conda/lib/python3.10/site-packages/seaborn/_oldcore.py:1119: FutureWarning: use_inf_as_na option is deprecated and will be removed in a future version. Convert inf values to NaN before operating instead.
with pd.option_context('mode.use_inf_as_na', True):
/opt/conda/lib/python3.10/site-packages/seaborn/_oldcore.py:1119: FutureWarning: use_inf_as_na option is deprecated and will be removed in a future version. Convert inf values to NaN before operating instead.
with pd.option_context('mode.use_inf_as_na', True):Correct
# Lines below will give you a hint or solution code
# step_3.hint()
step_3.solution_plot()Solution:
# Set the width and height of the figure
plt.figure(figsize=(12,6))
# Line chart showing the number of visitors to each museum over time
sns.lineplot(data=museum_data)
# Add title
plt.title("Monthly Visitors to Los Angeles City Museums")
/opt/conda/lib/python3.10/site-packages/seaborn/_oldcore.py:1119: FutureWarning: use_inf_as_na option is deprecated and will be removed in a future version. Convert inf values to NaN before operating instead.
  with pd.option_context('mode.use_inf_as_na', True):
/opt/conda/lib/python3.10/site-packages/seaborn/_oldcore.py:1119: FutureWarning: use_inf_as_na option is deprecated and will be removed in a future version. Convert inf values to NaN before operating instead.
  with pd.option_context('mode.use_inf_as_na', True):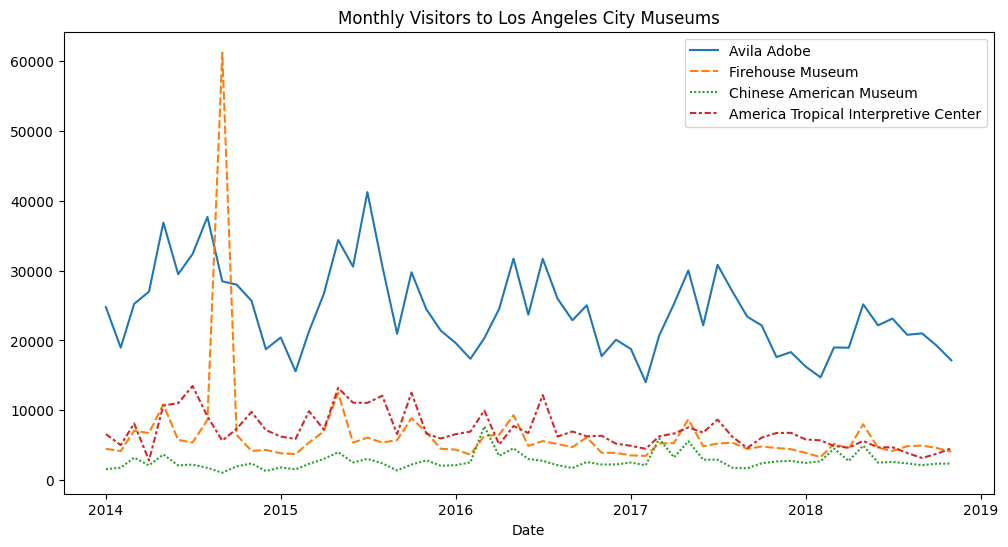
Step 4: Assess seasonality
步骤 4:评估季节性
When meeting with the employees at Avila Adobe, you hear that one major pain point is that the number of museum visitors varies greatly with the seasons, with low seasons (when the employees are perfectly staffed and happy) and also high seasons (when the employees are understaffed and stressed). You realize that if you can predict these high and low seasons, you can plan ahead to hire some additional seasonal employees to help out with the extra work.
在与 Avila Adobe 的员工见面时,你会听到一个主要痛点是博物馆参观人数随季节变化很大,有淡季(员工配备齐全、心情愉快),也有旺季(员工 人手不足且压力很大)。 您意识到,如果您可以预测这些旺季和淡季,您就可以提前计划雇用一些额外的季节性员工来帮助完成额外的工作。
Part A
A 部分
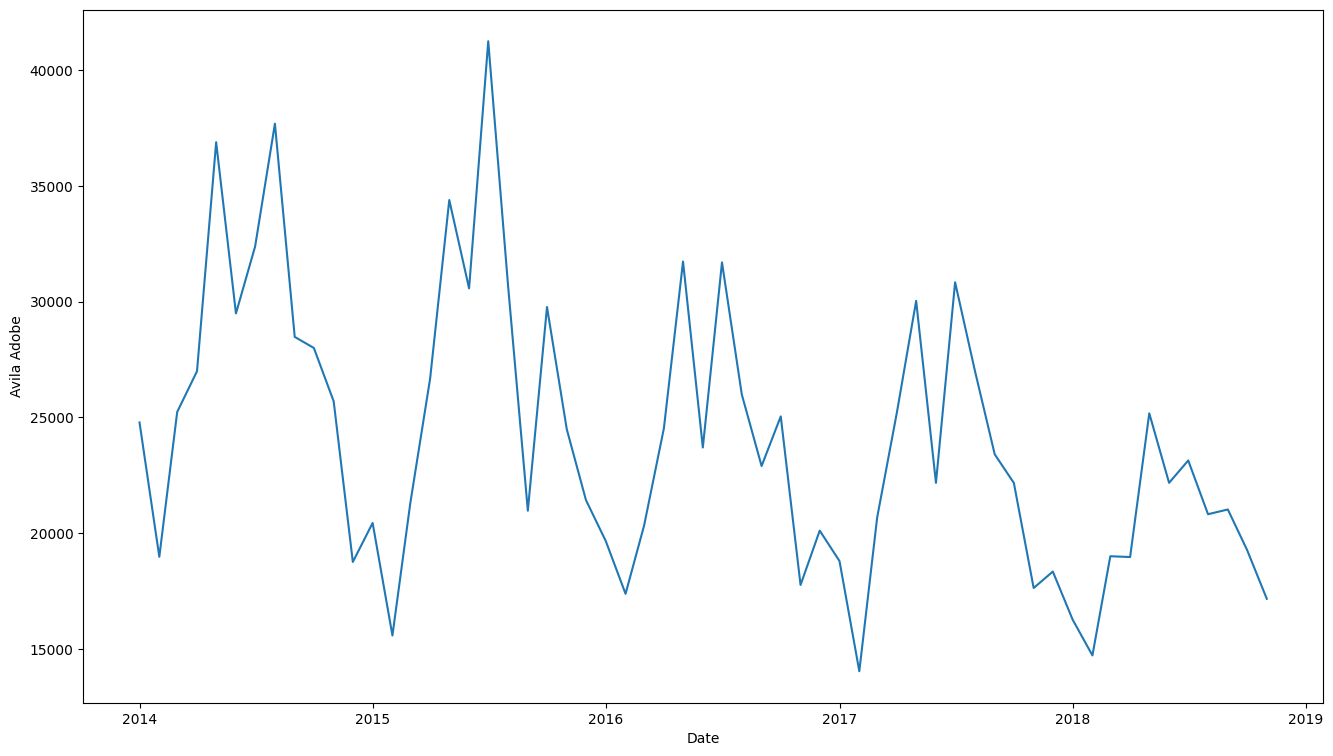
Create a line chart that shows how the number of visitors to Avila Adobe has evolved over time. (If your code returns an error, the first thing that you should check is that you've spelled the name of the column correctly! You must write the name of the column exactly as it appears in the dataset.)
创建一个折线图,显示 Avila Adobe 的访问者数量如何随时间变化。 (如果您的代码返回错误,您应该检查的第一件事是您是否正确拼写了列的名称!您必须完全按照数据集中显示的方式编写列的名称。)
# Line plot showing the number of visitors to Avila Adobe over time
#____ # Your code here
plt.figure(figsize=(16, 9))
sns.lineplot(data=museum_data['Avila Adobe'])
# Check your answer
step_4.a.check()Thank you for creating a line chart! To see how your code compares to the official solution, please use the code cell below.
/opt/conda/lib/python3.10/site-packages/seaborn/_oldcore.py:1119: FutureWarning: use_inf_as_na option is deprecated and will be removed in a future version. Convert inf values to NaN before operating instead.
  with pd.option_context('mode.use_inf_as_na', True):
/opt/conda/lib/python3.10/site-packages/seaborn/_oldcore.py:1119: FutureWarning: use_inf_as_na option is deprecated and will be removed in a future version. Convert inf values to NaN before operating instead.
with pd.option_context('mode.use_inf_as_na', True):Correct
# Lines below will give you a hint or solution code
# step_4.a.hint()
step_4.a.solution_plot()
Solution:
# Set the width and height of the figure
plt.figure(figsize=(12,6))
# Add title
plt.title("Monthly Visitors to Avila Adobe")
# Line chart showing the number of visitors to Avila Adobe over time
sns.lineplot(data=museum_data['Avila Adobe'])
# Add label for horizontal axis
plt.xlabel("Date")
/opt/conda/lib/python3.10/site-packages/seaborn/_oldcore.py:1119: FutureWarning: use_inf_as_na option is deprecated and will be removed in a future version. Convert inf values to NaN before operating instead.
  with pd.option_context('mode.use_inf_as_na', True):
/opt/conda/lib/python3.10/site-packages/seaborn/_oldcore.py:1119: FutureWarning: use_inf_as_na option is deprecated and will be removed in a future version. Convert inf values to NaN before operating instead.
  with pd.option_context('mode.use_inf_as_na', True):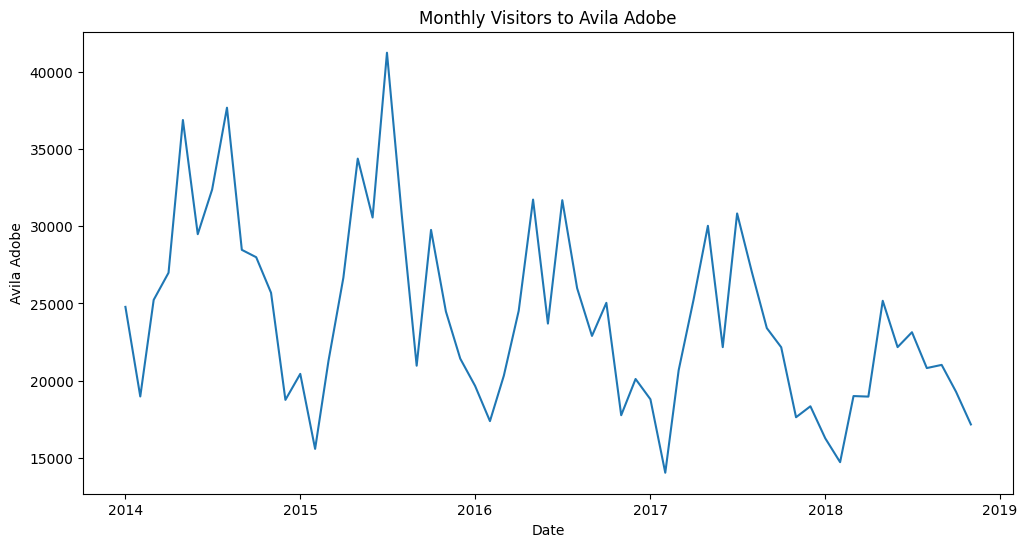
Part B
B 部分
Does Avila Adobe get more visitors:
Avila Adobe 是否获得了更多访问者:
- in September-February (in LA, the fall and winter months), or
- 九月至二月(在洛杉矶,秋季和冬季),或
- in March-August (in LA, the spring and summer)?
- 三月至八月(在洛杉矶,春季和夏季)?
Using this information, when should the museum staff additional seasonal employees?
利用此信息,博物馆工作人员何时应增加季节性员工?
step_4.b.hint()Hint: Look at the early part of each year (around January). Does the line chart dip to low values or reach relatively high values?
# Check your answer (Run this code cell to receive credit!)
step_4.b.solution()
Solution: The line chart generally dips to relatively low values around the early part of each year (in December and January), and reaches its highest values in the middle of the year (especially around May and June). Thus, Avila Adobe usually gets more visitors in March-August (or the spring and summer months). With this in mind, Avila Adobe could definitely benefit from hiring more seasonal employees to help with the extra work in March-August (the spring and summer)!
折线图通常会在每年年初(12 月和 1 月)左右降至相对较低的值,并在年中(尤其是 5 月和 6 月左右)达到最高值。 因此,Avila Adobe 通常在 3 月至 8 月(或春季和夏季)吸引更多访客。 考虑到这一点,Avila Adobe 绝对可以通过雇用更多季节性员工来帮助完成 3 月至 8 月(春季和夏季)的额外工作而受益!
Keep going
继续前行
Move on to learn about bar charts and heatmaps with a new dataset!
继续使用新数据集了解条形图和热图!