This notebook is an exercise in the Feature Engineering course. You can reference the tutorial at this link.
Introduction
介绍
In this exercise you'll explore our first unsupervised learning technique for creating features, k-means clustering.
在本练习中,您将探索我们第一个用于创建特征的无监督学习技术:k 均值聚类。
Run this cell to set everything up!
运行这个单元格来设置一切!
# Setup feedback system
from learntools.core import binder
binder.bind(globals())
from learntools.feature_engineering_new.ex4 import *

import matplotlib.pyplot as plt
import numpy as np
import pandas as pd
import seaborn as sns
from sklearn.cluster import KMeans
from sklearn.model_selection import cross_val_score
from xgboost import XGBRegressor

# Set Matplotlib defaults
plt.style.use("seaborn-whitegrid")
plt.rc("figure", autolayout=True)
plt.rc(
    "axes",
    labelweight="bold",
    labelsize="large",
    titleweight="bold",
    titlesize=14,
    titlepad=10,
)

def score_dataset(X, y, model=XGBRegressor()):
    # Label encoding for categoricals
    for colname in X.select_dtypes(["category", "object"]):
        X[colname], _ = X[colname].factorize()
    # Metric for Housing competition is RMSLE (Root Mean Squared Log Error)
    score = cross_val_score(
        model, X, y, cv=5, scoring="neg_mean_squared_log_error",
    )
    score = -1 * score.mean()
    score = np.sqrt(score)
    return score

# Prepare data
df = pd.read_csv("../input/fe-course-data/ames.csv")
The k-means algorithm is sensitive to scale. This means we need to be thoughtful about how and whether we rescale our features since we might get very different results depending on our choices. As a rule of thumb, if the features are already directly comparable (like a test result at different times), then you would not want to rescale. On the other hand, features that aren't on comparable scales (like height and weight) will usually benefit from rescaling. Sometimes, the choice won't be clear though. In that case, you should try to use common sense, remembering that features with larger values will be weighted more heavily.
k-means 算法对缩放敏感。 这意味着我们需要考虑如何以及是否重新调整我们的特征,因为根据我们的选择,我们可能会得到非常不同的结果。 根据经验,如果这些特征已经可以直接比较(例如不同时间的测试结果),那么您不会想要重新缩放。 另一方面,不具有可比尺度的特征(例如身高和体重)通常会受益于重新缩放。 有时,选择并不明确。 在这种情况下,您应该尝试使用常识,记住具有较大值的特征的权重会更大 。
1) Scaling Features
1) 缩放特征
Consider the following sets of features. For each, decide whether:
考虑以下几组特征。 对于每个,决定是否:
- they definitely should be rescaled,
- 它们绝对应该重新调整,
- they definitely should not be rescaled, or
- 它们绝对不应该重新缩放,或者
- either might be reasonable
- 两者都可能是合理的
Features:
特征:
LatitudeandLongitudeof cities in California- 加州城的‘纬度’和‘经度’
Lot AreaandLiving Areaof houses in Ames, Iowa- 爱荷华州艾姆斯房屋的
用地面积和居住面积 Number of DoorsandHorsepowerof a 1989 model car- 1989年车型的
车门数和马力
Once you've thought about your answers, run the cell below for discussion.
思考完答案后,请运行下面的单元格进行讨论。
# View the solution (Run this cell to receive credit!)
q_1.check()
Correct:
- No, since rescaling would distort the natural distances described by Latitude and Longitude.
- Either choice could be reasonable, but because the living area of a home tends to be more valuable per square foot, it would make sense to rescale these features so that lot area isn't weighted in the clustering out of proportion to its effect on
SalePrice, if that is what you were trying to predict. - Yes, since these don't have comparable units. Without rescaling, the number of doors in a car (usually 2 or 4) would have negligible weight compared to its horsepower (usually in the hundreds).
What you should take away from this is that the decision of whether and how to rescale features is rarely automatic -- it will usually depend on some domain knowledge about your data and what you're trying to predict. Comparing different rescaling schemes through cross-validation can also be helpful. (You might like to check out the preprocessing module in scikit-learn for some of the rescaling methods it offers.)
- 不可以,因为重新缩放会扭曲纬度和经度描述的自然距离。
- 这两种选择都可能是合理的,但由于房屋的居住面积每平方英尺往往更有价值,因此重新调整这些特征是有意义的,这样地块面积在聚类中的权重就不会与其对销售价格的影响不成比例。 如果这就是您想要预测的。
- 是的,因为这些没有可比较的单位。 如果不重新调整比例,汽车的车门数量(通常为 2 或 4 个)与其马力(通常为数百个)相比,其权重可以忽略不计。
您应该从中可以了解到,是否以及如何重新调整特征的决定很少是自动的——它通常取决于有关您的数据和您想要预测的领域的一些知识。 通过交叉验证比较不同的缩放方案也很有帮助。 (您可能想查看 scikit-learn 中的预处理模块,了解它提供的一些重新缩放方法。)
2) Create a Feature of Cluster Labels
2) 创建聚类标签的特征
Creating a k-means clustering with the following parameters:
使用以下参数创建 k-means 聚类:
- features:
LotArea,TotalBsmtSF,FirstFlrSF,SecondFlrSF,GrLivArea - 特征:
LotArea、TotalBsmtSF、FirstFlrSF、SecondFlrSF、GrLivArea - number of clusters: 10
- 簇数:10
- iterations: 10
- 迭代次数:10
(This may take a moment to complete.)
(这可能需要一些时间才能完成。)
X = df.copy()
y = X.pop("SalePrice")

# YOUR CODE HERE: Define a list of the features to be used for the clustering
# features = ____
features = ["LotArea", "TotalBsmtSF", "FirstFlrSF", "SecondFlrSF", "GrLivArea"]

# Standardize
X_scaled = X.loc[:, features]
X_scaled = (X_scaled - X_scaled.mean(axis=0)) / X_scaled.std(axis=0)

# YOUR CODE HERE: Fit the KMeans model to X_scaled and create the cluster labels
#kmeans = KMeans(____, random_state=0)
#X["Cluster"] = ____

kmeans = KMeans(n_clusters=10, random_state=0)
#X["Cluster"] = kmeans.fit_transform(X_scaled)
X["Cluster"] = kmeans.fit_predict(X_scaled)
# Check your answer
q_2.check()
/opt/conda/lib/python3.10/site-packages/sklearn/cluster/_kmeans.py:870: FutureWarning: The default value of n_init will change from 10 to 'auto' in 1.4. Set the value of n_init explicitly to suppress the warning
warnings.warn(Correct
# Lines below will give you a hint or solution code
#q_2.hint()
q_2.solution()
Solution:
X = df.copy()
y = X.pop("SalePrice")

features = [
    "LotArea",
    "TotalBsmtSF",
    "FirstFlrSF",
    "SecondFlrSF",
    "GrLivArea",
]

# Standardize
X_scaled = X.loc[:, features]
X_scaled = (X_scaled - X_scaled.mean(axis=0)) / X_scaled.std(axis=0)

kmeans = KMeans(n_clusters=10, n_init=10, random_state=0)
X["Cluster"] = kmeans.fit_predict(X_scaled)
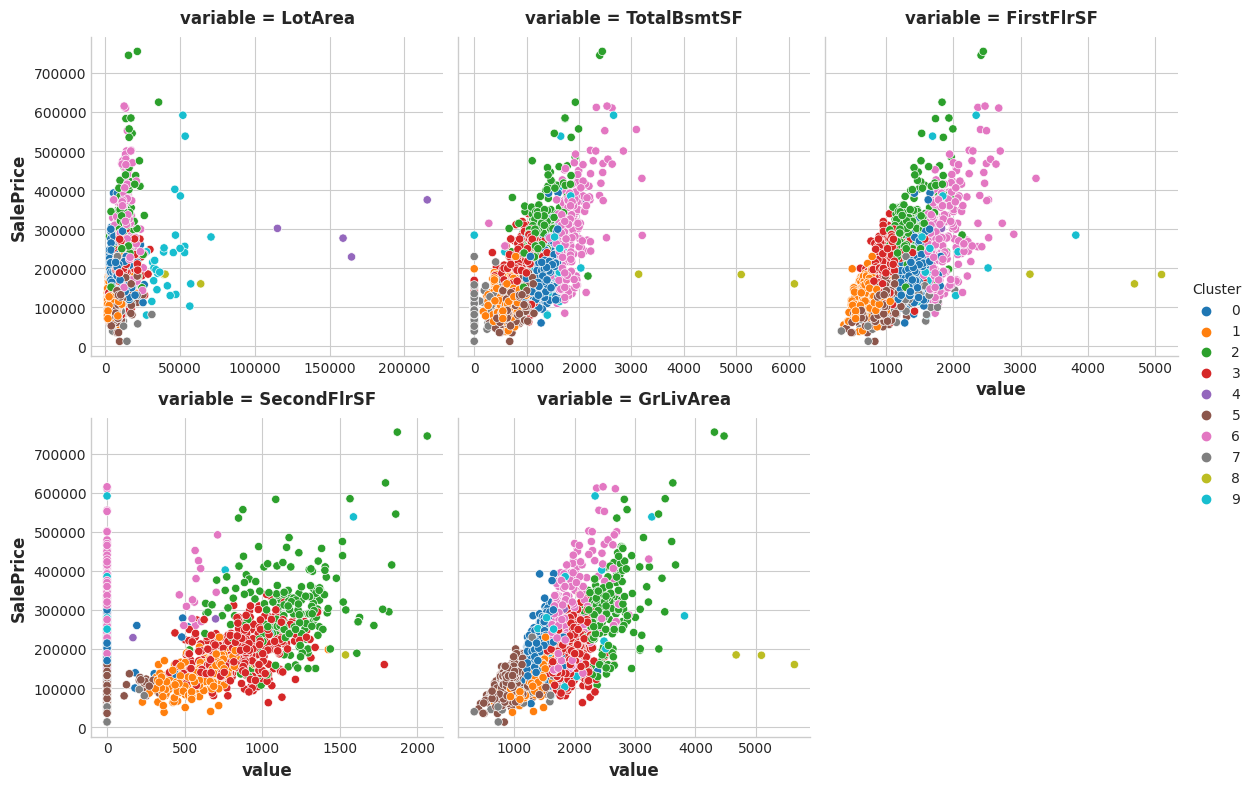
You can run this cell to see the result of the clustering, if you like.
如果您愿意,您可以运行此单元来查看聚类结果。
Xy = X.copy()
Xy["Cluster"] = Xy.Cluster.astype("category")
Xy["SalePrice"] = y
sns.relplot(
    x="value", y="SalePrice", hue="Cluster", col="variable",
    height=4, aspect=1, facet_kws={'sharex': False}, col_wrap=3,
    data=Xy.melt(
        value_vars=features, id_vars=["SalePrice", "Cluster"],
    ),
);
And as before, score_dataset will score your XGBoost model with this new feature added to training data.
score_dataset(X, y)0.1424377124868132The k-means algorithm offers an alternative way of creating features. Instead of labelling each feature with the nearest cluster centroid, it can measure the distance from a point to all the centroids and return those distances as features.
k-means 算法提供了另一种创建特征的方法。 它不是用最近的聚类质心来标记每个特征,而是可以测量从一个点到所有质心的距离并将这些距离作为特征返回。
3) Cluster-Distance Features
3) 簇距离特征
Now add the cluster-distance features to your dataset. You can get these distance features by using the fit_transform method of kmeans instead of fit_predict.
现在将聚类距离特征添加到您的数据集中。 您可以使用kmeans的fit_transform方法而不是fit_predict来获取这些距离特征。
kmeans = KMeans(n_clusters=10, n_init=10, random_state=0)

# YOUR CODE HERE: Create the cluster-distance features using `fit_transform`
#X_cd = ____
X_cd = kmeans.fit_transform(X_scaled, )

# Label features and join to dataset
X_cd = pd.DataFrame(X_cd, columns=[f"Centroid_{i}" for i in range(X_cd.shape[1])])
X = X.join(X_cd)

# Check your answer
q_3.check()
Correct
# Lines below will give you a hint or solution code
#q_3.hint()
q_3.solution()
Solution:
kmeans = KMeans(n_clusters=10, n_init=10, random_state=0)

# YOUR CODE HERE: Create the cluster-distance features using `fit_transform`
X_cd = kmeans.fit_transform(X_scaled)

# Label features and join to dataset
X_cd = pd.DataFrame(X_cd, columns=[f"Centroid_{i}" for i in range(X_cd.shape[1])])
X = X.join(X_cd)
Run this cell to score these new features, if you like.
如果您愿意,请运行此单元格来对这些新特征进行评分。
score_dataset(X, y)0.13822238726596872Keep Going
继续前进
应用主成分分析根据数据的变化创建特征。
Apply principal components analysis to create features from variation in your data.