This notebook is an exercise in the Data Visualization course. You can reference the tutorial at this link.
In this exercise, you will use your new knowledge to propose a solution to a real-world scenario. To succeed, you will need to import data into Python, answer questions using the data, and generate scatter plots to understand patterns in the data.
在本练习中,您将使用新知识提出现实场景的解决方案。 为了成功,您需要将数据导入 Python,使用数据回答问题,并生成 散点图 以了解数据中的模式。
Scenario
场景
You work for a major candy producer, and your goal is to write a report that your company can use to guide the design of its next product. Soon after starting your research, you stumble across this very interesting dataset containing results from a fun survey to crowdsource favorite candies.
您在一家大型糖果生产商工作,您的目标是撰写一份报告,供您的公司用来指导下一款产品的设计。 开始研究后不久,您偶然发现了这个[非常有趣的数据集](https:// Fivethirtyeight.com/features/the-ultimate-halloween-candy-power-ranking/),其中包含一项有趣的调查结果,以众包最喜欢的糖果。
Setup
设置
Run the next cell to import and configure the Python libraries that you need to complete the exercise.
运行下一个单元以导入和配置完成练习所需的 Python 库。
import pandas as pd
pd.plotting.register_matplotlib_converters()
import matplotlib.pyplot as plt
%matplotlib inline
import seaborn as sns
print("Setup Complete")
Setup CompleteThe questions below will give you feedback on your work. Run the following cell to set up our feedback system.
以下问题将为您提供有关您工作的反馈。 运行以下单元格来设置我们的反馈系统。
# Set up code checking
import os
if not os.path.exists("../input/candy.csv"):
    os.symlink("../input/data-for-datavis/candy.csv", "../input/candy.csv")
from learntools.core import binder
binder.bind(globals())
from learntools.data_viz_to_coder.ex4 import *
print("Setup Complete")
Setup CompleteStep 1: Load the Data
第 1 步:加载数据
Read the candy data file into candy_data. Use the "id" column to label the rows.
将糖果数据文件读入candy_data。 使用"id"列来标记行。
# Path of the file to read
candy_filepath = "../input/candy.csv"

# Fill in the line below to read the file into a variable candy_data
#candy_data = ____
candy_data = pd.read_csv(candy_filepath, index_col=['id'])
# Run the line below with no changes to check that you've loaded the data correctly
step_1.check()
Correct
# Lines below will give you a hint or solution code
step_1.hint()
step_1.solution()
Hint: Use pd.read_csv, and follow it with two pieces of text that are enclosed in parentheses and separated by commas. (1) The filepath for the dataset is provided in candy_filepath. (2) Use the "id" column to label the rows.
Solution:
candy_data = pd.read_csv(candy_filepath, index_col="id")Step 2: Review the data
第 2 步:查看数据
Use a Python command to print the first five rows of the data.
使用 Python 命令打印前五行数据。
# Print the first five rows of the data
#____ # Your code here

candy_data.head()| competitorname | chocolate | fruity | caramel | peanutyalmondy | nougat | crispedricewafer | hard | bar | pluribus | sugarpercent | pricepercent | winpercent | |
|---|---|---|---|---|---|---|---|---|---|---|---|---|---|
| id | |||||||||||||
| 0 | 100 Grand | Yes | No | Yes | No | No | Yes | No | Yes | No | 0.732 | 0.860 | 66.971725 |
| 1 | 3 Musketeers | Yes | No | No | No | Yes | No | No | Yes | No | 0.604 | 0.511 | 67.602936 |
| 2 | Air Heads | No | Yes | No | No | No | No | No | No | No | 0.906 | 0.511 | 52.341465 |
| 3 | Almond Joy | Yes | No | No | Yes | No | No | No | Yes | No | 0.465 | 0.767 | 50.347546 |
| 4 | Baby Ruth | Yes | No | Yes | Yes | Yes | No | No | Yes | No | 0.604 | 0.767 | 56.914547 |
The dataset contains 83 rows, where each corresponds to a different candy bar. There are 13 columns:
该数据集包含 83 行,每行对应一个不同的糖果条。 有 13 列:
'competitorname'contains the name of the candy bar.'competitorname'包含糖果条的名称。- the next 9 columns (from
'chocolate'to'pluribus') describe the candy. For instance, rows with chocolate candies have"Yes"in the'chocolate'column (and candies without chocolate have"No"in the same column). - 接下来的 9 列(从
巧克力到综合)描述了糖果。 例如,含有巧克力糖果的行在巧克力列中具有是(而不含巧克力的糖果在同一列中具有否)。 'sugarpercent'provides some indication of the amount of sugar, where higher values signify higher sugar content.sugarpercent提供了糖含量的一些指示,其中较高的值表示较高的糖含量。'pricepercent'shows the price per unit, relative to the other candies in the dataset.pricepercent显示相对于数据集中其他糖果的单位价格。'winpercent'is calculated from the survey results; higher values indicate that the candy was more popular with survey respondents.winpercent是根据调查结果计算得出的; 较高的值表明该糖果更受调查受访者欢迎。
Use the first five rows of the data to answer the questions below.
使用数据的前五行回答以下问题。
# Fill in the line below: Which candy was more popular with survey respondents:
# '3 Musketeers' or 'Almond Joy'?  (Please enclose your answer in single quotes.)
# 填写下面一行:哪种糖果更受受访者欢迎:“三剑客”还是“杏仁乐”? (请将您的答案用单引号引起来。)
#more_popular = ____

# more_popular = "3 Musketeers"
more_popular = candy_data.loc[candy_data[candy_data['competitorname'].isin(['3 Musketeers', 'Almond Joy'])]['winpercent'].idxmax()]['competitorname']

# Fill in the line below: Which candy has higher sugar content: 'Air Heads'
# or 'Baby Ruth'? (Please enclose your answer in single quotes.)
# 填写下面一行:哪种糖果含糖量更高:“Air Heads”或“Baby Ruth”? (请将您的答案用单引号引起来。)
# more_sugar = ____
# more_sugar = "Air Heads"
more_sugar = candy_data.loc[candy_data[candy_data['competitorname'].isin(['Air Heads', 'Baby Ruth'])]['sugarpercent'].idxmax()]['competitorname']
# Check your answers
step_2.check()
Correct
# Lines below will give you a hint or solution code
#step_2.hint()
step_2.solution()
Solution:
# Print the first five rows of the data
candy_data.head()
# Which candy was more popular with survey respondents:
# '3 Musketeers' or 'Almond Joy'?
more_popular = '3 Musketeers'
# Which candy has higher sugar content: 'Air Heads'
# or 'Baby Ruth'?
more_sugar = 'Air Heads'
Step 3: The role of sugar
第三步:糖的作用
Do people tend to prefer candies with higher sugar content?
人们是否更喜欢含糖量较高的糖果?
Part A
A 部分
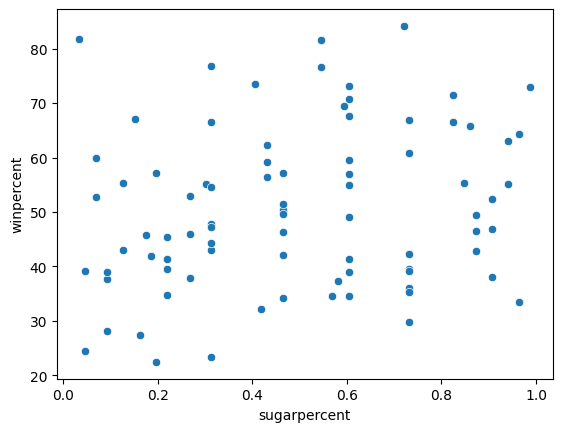
Create a scatter plot that shows the relationship between 'sugarpercent' (on the horizontal x-axis) and 'winpercent' (on the vertical y-axis). Don't add a regression line just yet -- you'll do that in the next step!
创建一个散点图,显示sugarpercent(在水平 x 轴上)和winpercent(在垂直 y 轴上)之间的关系。 暂时不要添加回归线 - 您将在下一步中执行此操作!
# Scatter plot showing the relationship between 'sugarpercent' and 'winpercent'
#____ # Your code here
sns.scatterplot(x=candy_data['sugarpercent'], y=candy_data['winpercent'])
# Check your answer
step_3.a.check()
Correct

# Lines below will give you a hint or solution code
#step_3.a.hint()
step_3.a.solution_plot()
Solution:
# Scatter plot showing the relationship between 'sugarpercent' and 'winpercent'
sns.scatterplot(x=candy_data['sugarpercent'], y=candy_data['winpercent'])
Part B
B 部分
Does the scatter plot show a strong correlation between the two variables? If so, are candies with more sugar relatively more or less popular with the survey respondents?
散点图是否显示两个变量之间存在强相关性? 如果是这样,含糖量较高的糖果相对来说更受调查受访者欢迎还是更不受欢迎?
step_3.b.hint()Hint: Compare candies with higher sugar content (on the right side of the chart) to candies with lower sugar content (on the left side of the chart). Is one group clearly more popular than the other?
# Check your answer (Run this code cell to receive credit!)
step_3.b.solution()
Solution: The scatter plot does not show a strong correlation between the two variables. Since there is no clear relationship between the two variables, this tells us that sugar content does not play a strong role in candy popularity.
散点图并未显示两个变量之间存在很强的相关性。 由于这两个变量之间没有明确的关系,这表明含糖量对糖果的受欢迎程度并没有起到很大的作用。
Step 4: Take a closer look
步骤 4:仔细观察
Part A
A 部分
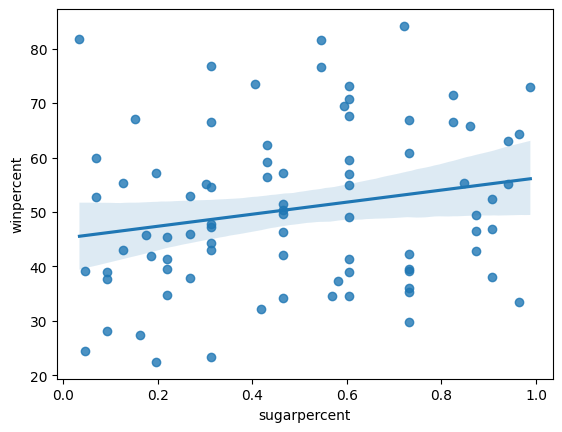
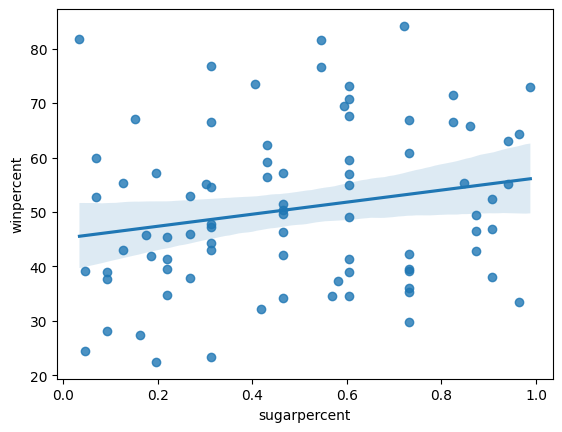
Create the same scatter plot you created in Step 3, but now with a regression line!
创建与您在步骤 3 中创建的散点图相同的散点图,但现在带有回归线!
# Scatter plot w/ regression line showing the relationship between 'sugarpercent' and 'winpercent'
#____ # Your code here

sns.regplot(x=candy_data['sugarpercent'], y=candy_data['winpercent'])
# Check your answer
step_4.a.check()
Correct
# Lines below will give you a hint or solution code
#step_4.a.hint()
step_4.a.solution_plot()
Solution:
# Scatter plot w/ regression line showing the relationship between 'sugarpercent' and 'winpercent'
sns.regplot(x=candy_data['sugarpercent'], y=candy_data['winpercent'])
Part B
B 部分
According to the plot above, is there a slight correlation between 'winpercent' and 'sugarpercent'? What does this tell you about the candy that people tend to prefer?
根据上图,winpercent和sugarpercent之间是否存在轻微相关性? 关于人们更喜欢的糖果,这告诉你什么?
#step_4.b.hint()# Check your answer (Run this code cell to receive credit!)
step_4.b.solution()Solution: Since the regression line has a slightly positive slope, this tells us that there is a slightly positive correlation between 'winpercent' and 'sugarpercent'. Thus, people have a slight preference for candies containing relatively more sugar.
由于回归线的斜率稍为正,这告诉我们winpercent和sugarpercent之间存在轻微的正相关关系。 因此,人们对含糖量相对较多的糖果略有偏爱。
Step 5: Chocolate!
第五步:巧克力!
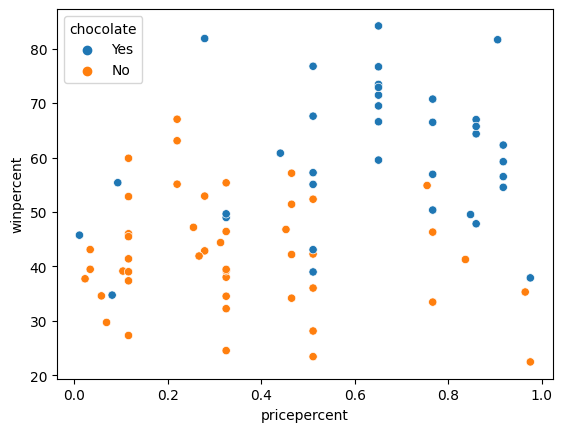
In the code cell below, create a scatter plot to show the relationship between 'pricepercent' (on the horizontal x-axis) and 'winpercent' (on the vertical y-axis). Use the 'chocolate' column to color-code the points. Don't add any regression lines just yet -- you'll do that in the next step!
在下面的代码单元中,创建一个散点图来显示pricepercent(在水平 x 轴上)和winpercent(在垂直 y 轴上)之间的关系。 使用巧克力列对点进行颜色编码。 暂时不要添加任何回归线 - 您将在下一步中执行此操作!
# Scatter plot showing the relationship between 'pricepercent', 'winpercent', and 'chocolate'
#____ # Your code here
# sns.lmplot(x='pricepercent', y='winpercent', hue='chocolate', data=candy_data)

sns.scatterplot(x='pricepercent', y='winpercent', hue='chocolate', data=candy_data)
# Check your answer
step_5.check()
Correct
# Lines below will give you a hint or solution code
#step_5.hint()
step_5.solution_plot()
Solution:
# Scatter plot showing the relationship between 'pricepercent', 'winpercent', and 'chocolate'
sns.scatterplot(x=candy_data['pricepercent'], y=candy_data['winpercent'], hue=candy_data['chocolate'])

Can you see any interesting patterns in the scatter plot? We'll investigate this plot further by adding regression lines in the next step!
你能在散点图中看到任何有趣的模式吗? 我们将通过在下一步中添加回归线来进一步研究该图!
Step 6: Investigate chocolate
第 6 步:研究巧克力
Part A
A 部分
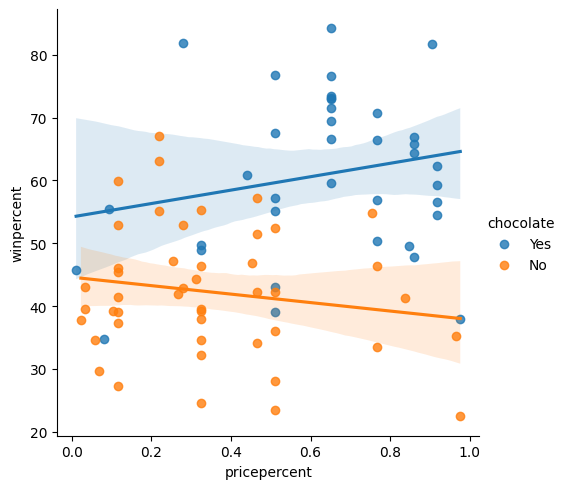
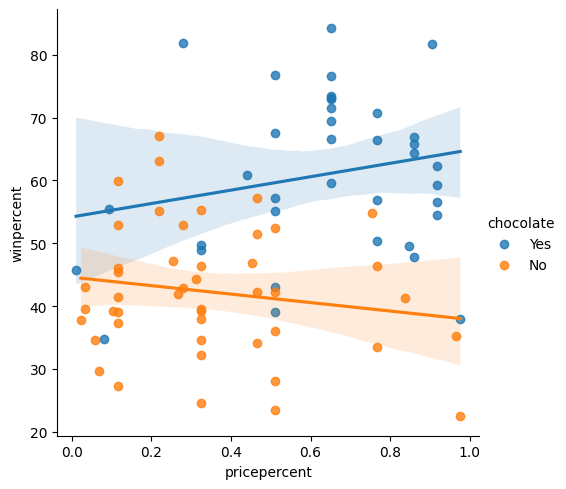
Create the same scatter plot you created in Step 5, but now with two regression lines, corresponding to (1) chocolate candies and (2) candies without chocolate.
创建您在步骤 5 中创建的相同散点图,但现在有两条回归线,对应于 (1) 巧克力糖果和 (2) 不含巧克力的糖果。
# Color-coded scatter plot w/ regression lines
#____ # Your code here
# plt.figure(figsize=(16,9))
sns.lmplot(x='pricepercent', y='winpercent', hue='chocolate', data=candy_data)
# Check your answer
step_6.a.check()
Correct
# Lines below will give you a hint or solution code
#step_6.a.hint()
step_6.a.solution_plot()
Solution:
# Color-coded scatter plot w/ regression lines
sns.lmplot(x="pricepercent", y="winpercent", hue="chocolate", data=candy_data)
Part B
B 部分
Using the regression lines, what conclusions can you draw about the effects of chocolate and price on candy popularity?
使用回归线,您可以得出关于巧克力和价格对糖果受欢迎程度的影响的什么结论?
#step_6.b.hint()# Check your answer (Run this code cell to receive credit!)
step_6.b.solution()Solution: We'll begin with the regression line for chocolate candies. Since this line has a slightly positive slope, we can say that more expensive chocolate candies tend to be more popular (than relatively cheaper chocolate candies). Likewise, since the regression line for candies without chocolate has a negative slope, we can say that if candies don't contain chocolate, they tend to be more popular when they are cheaper. One important note, however, is that the dataset is quite small -- so we shouldn't invest too much trust in these patterns! To inspire more confidence in the results, we should add more candies to the dataset.
我们将从巧克力糖的回归线开始。 由于这条线有一个稍微正的斜率,我们可以说更昂贵的巧克力糖果往往更受欢迎(比较相对便宜的巧克力糖果)。 同样,由于不含巧克力的糖果的回归线具有负斜率,因此我们可以说,如果糖果不含巧克力,那么它们在更便宜时往往会更受欢迎。 然而,一个重要的注意事项是数据集非常小——所以我们不应该对这些模式投入太多信任! 为了激发对结果的更多信心,我们应该向数据集中添加更多糖果。
Step 7: Everybody loves chocolate.
步骤 7:每个人都喜欢巧克力。
Part A
A 部分
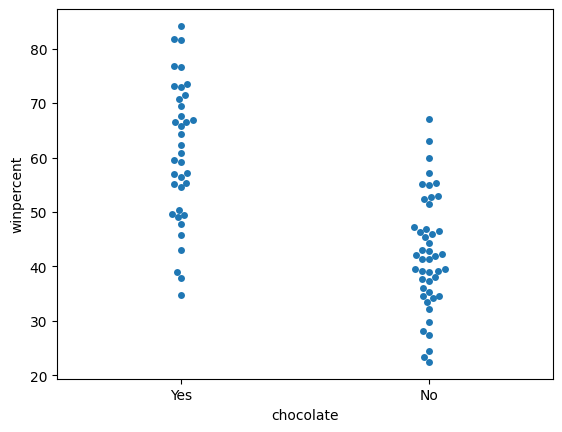
Create a categorical scatter plot to highlight the relationship between 'chocolate' and 'winpercent'. Put 'chocolate' on the (horizontal) x-axis, and 'winpercent' on the (vertical) y-axis.
创建分类散点图以突出显示chocolate和winpercent之间的关系。 将chocolate放在(水平)x 轴上,将winpercent放在(垂直)y 轴上。
# Scatter plot showing the relationship between 'chocolate' and 'winpercent'
#____ # Your code here
sns.swarmplot(x='chocolate', y='winpercent', data=candy_data)
# Check your answer
step_7.a.check()
Correct

# Lines below will give you a hint or solution code
#step_7.a.hint()
step_7.a.solution_plot()
Solution:
# Scatter plot showing the relationship between 'chocolate' and 'winpercent'
sns.swarmplot(x=candy_data['chocolate'], y=candy_data['winpercent'])
Part B
B 部分
You decide to dedicate a section of your report to the fact that chocolate candies tend to be more popular than candies without chocolate. Which plot is more appropriate to tell this story: the plot from Step 6, or the plot from Step 7?
您决定在报告中专门介绍一个事实:巧克力糖果往往比不含巧克力的糖果更受欢迎。 哪个情节更适合讲述这个故事:第 6 步的情节,还是第 7 步的情节?
#step_7.b.hint()# Check your answer (Run this code cell to receive credit!)
step_7.b.solution()Solution: In this case, the categorical scatter plot from Step 7 is the more appropriate plot. While both plots tell the desired story, the plot from Step 6 conveys far more information that could distract from the main point.
在这种情况下,步骤 7 中的分类散点图是更合适的图。 虽然这两个情节都讲述了想要的故事,但第 6 步中的情节传达了更多可能分散注意力的信息。
Keep going
继续前进
Explore histograms and density plots.
探索直方图和密度图。