This notebook is an exercise in the Data Visualization course. You can reference the tutorial at this link.
Now it's time for you to demonstrate your new skills with a project of your own!
现在是您通过自己的项目展示您的新技能的时候了!
In this exercise, you will work with a dataset of your choosing. Once you've selected a dataset, you'll design and create your own plot to tell interesting stories behind the data!
在本练习中,您将使用您选择的数据集。 选择数据集后,您将设计并创建自己的图表来讲述数据背后的有趣故事!
Setup
设置
Run the next cell to import and configure the Python libraries that you need to complete the exercise.
运行下一个单元以导入和配置完成练习所需的 Python 库。
import pandas as pd
pd.plotting.register_matplotlib_converters()
import matplotlib.pyplot as plt
%matplotlib inline
import seaborn as sns
print("Setup Complete")
Setup CompleteThe questions below will give you feedback on your work. Run the following cell to set up the feedback system.
以下问题将为您提供有关您工作的反馈。 运行以下单元格来设置反馈系统。
# Set up code checking
from learntools.core import binder
binder.bind(globals())
from learntools.data_viz_to_coder.ex7 import *
print("Setup Complete")
Setup CompleteStep 1: Attach a dataset to the notebook
步骤 1:将数据集附加到笔记本
Begin by selecting a CSV dataset from Kaggle Datasets. If you're unsure how to do this, please revisit the instructions in the previous tutorial.
首先从 Kaggle 数据集 选择 CSV 数据集。 如果您不确定如何执行此操作,请重新访问上一教程中的说明。
Once you have selected a dataset, click on the [+ Add data] option in the top right corner. This will generate a pop-up window that you can use to search for your chosen dataset.
选择数据集后,单击右上角的 [+ 添加数据] 选项。 这将生成一个弹出窗口,您可以使用它来搜索您选择的数据集。
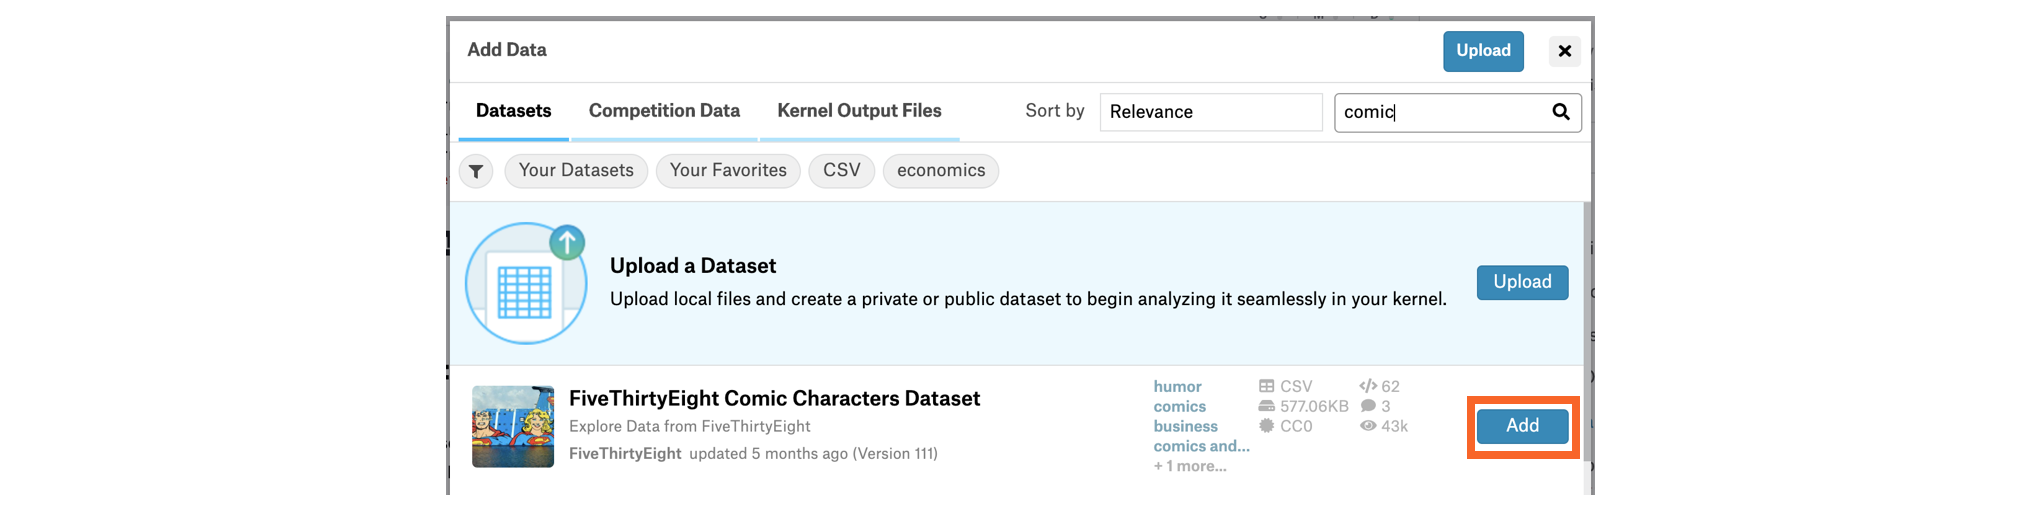
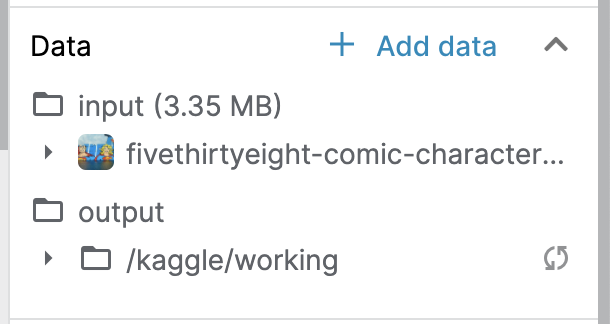
Once you have found the dataset, click on the [Add] button to attach it to the notebook. You can check that it was successful by looking at the Data dropdown menu to the right of the notebook -- look for an input folder containing a subfolder that matches the name of the dataset.
找到数据集后,单击 [添加] 按钮将其附加到笔记本。 您可以通过查看笔记本右侧的 Data 下拉菜单来检查它是否成功 - 查找包含与数据集名称匹配的子文件夹的 input 文件夹。
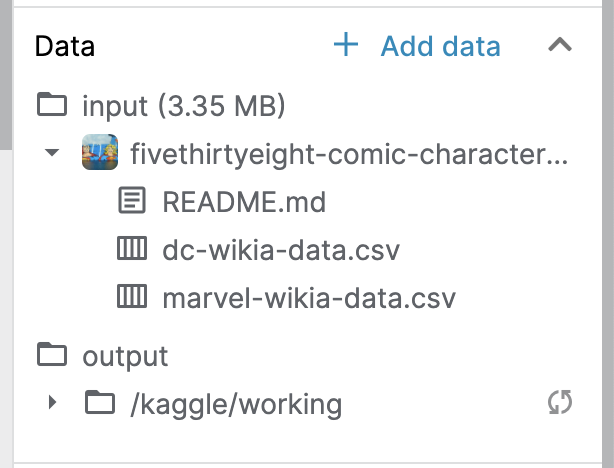
You can click on the carat to the left of the name of the dataset to double-check that it contains a CSV file. For instance, the image below shows that the example dataset contains two CSV files: (1) dc-wikia-data.csv, and (2) marvel-wikia-data.csv.
您可以单击数据集名称左侧的克拉来仔细检查它是否包含 CSV 文件。 例如,下图显示示例数据集包含两个 CSV 文件:(1) dc-wikia-data.csv 和 (2) marvel-wikia-data.csv。
Once you've uploaded a dataset with a CSV file, run the code cell below without changes to receive credit for your work!
上传包含 CSV 文件的数据集后,运行下面的代码单元不进行任何更改即可获得您的工作成果!
# Check for a dataset with a CSV file
step_1.check()
Correct:
Step 2: Specify the filepath
第二步:指定文件路径
Now that the dataset is attached to the notebook, you can find its filepath. To do this, begin by clicking on the CSV file you'd like to use. This will open the CSV file in a tab below the notebook. You can find the filepath towards the top of this new tab.
现在数据集已附加到笔记本,您可以找到其文件路径。 为此,请首先单击您要使用的 CSV 文件。 这将在笔记本下方的选项卡中打开 CSV 文件。 您可以在这个新选项卡的顶部找到文件路径。
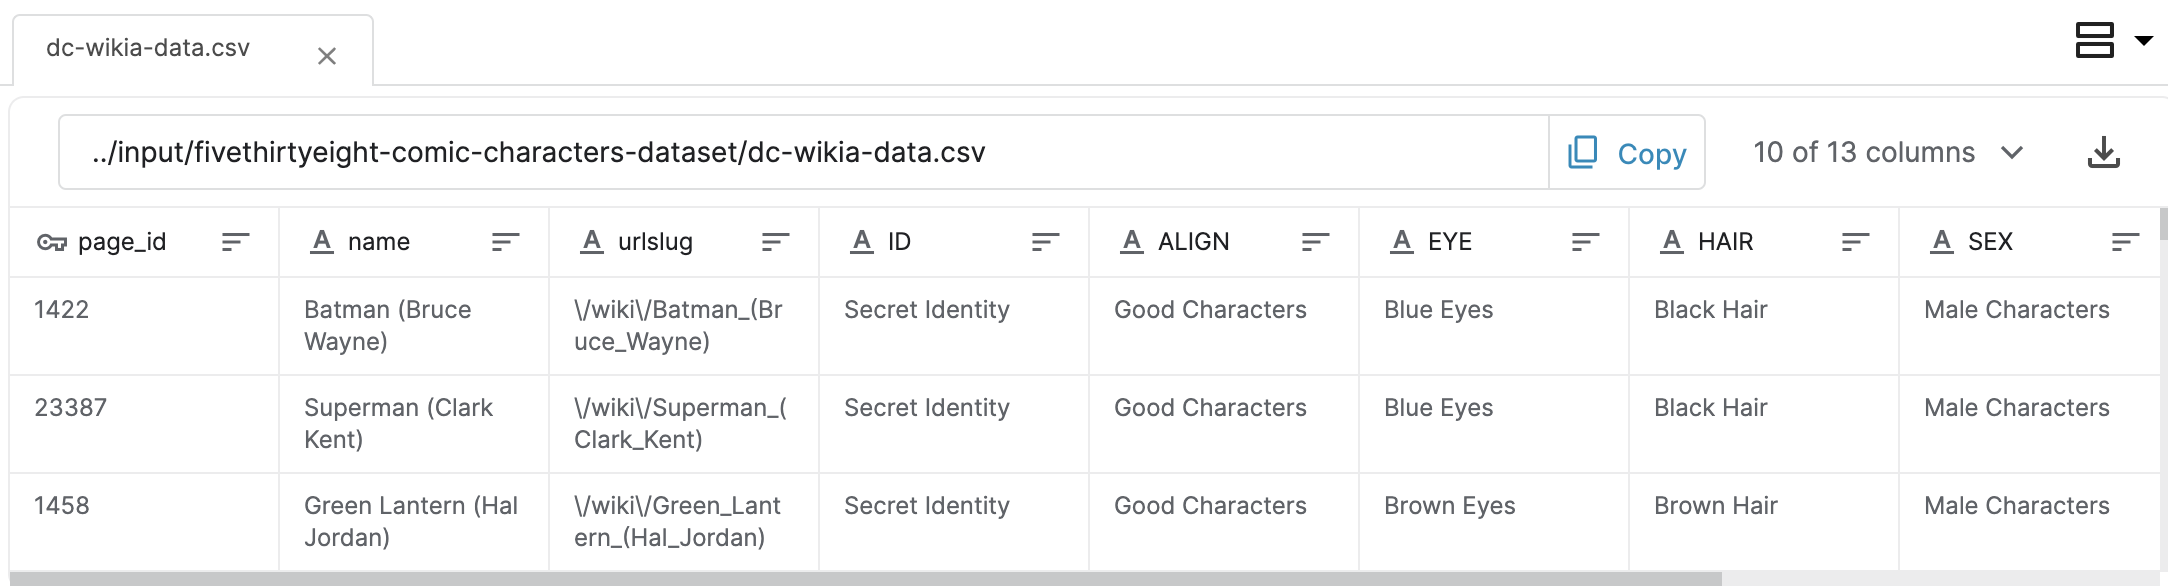
After you find the filepath corresponding to your dataset, fill it in as the value for my_filepath in the code cell below, and run the code cell to check that you've provided a valid filepath. For instance, in the case of this example dataset, we would set
找到与数据集对应的文件路径后,将其填写为下面代码单元中my_filepath的值,然后运行代码单元以检查您是否提供了有效的文件路径。 例如,在此示例数据集的情况下,我们将设置
my_filepath = "../input/fivethirtyeight-comic-characters-dataset/dc-wikia-data.csv"Note that you must enclose the filepath in quotation marks; otherwise, the code will return an error.
请注意,您必须将文件路径用引号引起来; 否则,代码将返回错误。
Once you've entered the filepath, you can close the tab below the notebook by clicking on the [X] at the top of the tab
输入文件路径后,您可以通过单击选项卡顶部的 [X] 来关闭笔记本下方的选项卡。
# Fill in the line below: Specify the path of the CSV file to read
#my_filepath = ____

my_filepath = "../input/fivethirtyeight-comic-characters-dataset/dc-wikia-data.csv"

# Check for a valid filepath to a CSV file in a dataset
step_2.check()
Correct:
Step 3: Load the data
Use the next code cell to load your data file into my_data. Use the filepath that you specified in the previous step.
# Fill in the line below: Read the file into a variable my_data
# my_data = ____

my_data = pd.read_csv(my_filepath)

# Check that a dataset has been uploaded into my_data
step_3.check()
Correct:
After the code cell above is marked correct, run the code cell below without changes to view the first five rows of the data.
在上面的代码单元标记为正确后,不做任何更改地运行下面的代码单元以查看前五行数据。
# Print the first five rows of the data
my_data.head()| page_id | name | urlslug | ID | ALIGN | EYE | HAIR | SEX | GSM | ALIVE | APPEARANCES | FIRST APPEARANCE | YEAR | |
|---|---|---|---|---|---|---|---|---|---|---|---|---|---|
| 0 | 1422 | Batman (Bruce Wayne) | \/wiki\/Batman_(Bruce_Wayne) | Secret Identity | Good Characters | Blue Eyes | Black Hair | Male Characters | NaN | Living Characters | 3093.0 | 1939, May | 1939.0 |
| 1 | 23387 | Superman (Clark Kent) | \/wiki\/Superman_(Clark_Kent) | Secret Identity | Good Characters | Blue Eyes | Black Hair | Male Characters | NaN | Living Characters | 2496.0 | 1986, October | 1986.0 |
| 2 | 1458 | Green Lantern (Hal Jordan) | \/wiki\/Green_Lantern_(Hal_Jordan) | Secret Identity | Good Characters | Brown Eyes | Brown Hair | Male Characters | NaN | Living Characters | 1565.0 | 1959, October | 1959.0 |
| 3 | 1659 | James Gordon (New Earth) | \/wiki\/James_Gordon_(New_Earth) | Public Identity | Good Characters | Brown Eyes | White Hair | Male Characters | NaN | Living Characters | 1316.0 | 1987, February | 1987.0 |
| 4 | 1576 | Richard Grayson (New Earth) | \/wiki\/Richard_Grayson_(New_Earth) | Secret Identity | Good Characters | Blue Eyes | Black Hair | Male Characters | NaN | Living Characters | 1237.0 | 1940, April | 1940.0 |
Step 4: Visualize the data
步骤 4:可视化数据
Use the next code cell to create a figure that tells a story behind your dataset. You can use any chart type (line chart, bar chart, heatmap, etc) of your choosing!
使用下一个代码单元创建一个图表来讲述数据集背后的故事。 您可以使用您选择的任何图表类型(折线图、条形图、热力图等)!
# Create a plot
# ____ # Your code here
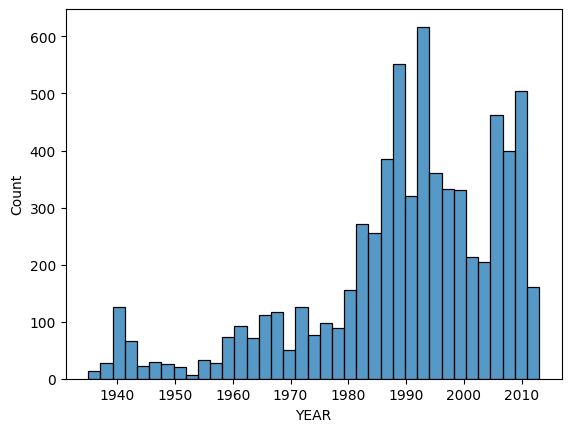
sns.histplot(my_data['YEAR'])
# Check that a figure appears below
step_4.check()/opt/conda/lib/python3.10/site-packages/seaborn/_oldcore.py:1119: FutureWarning: use_inf_as_na option is deprecated and will be removed in a future version. Convert inf values to NaN before operating instead.
with pd.option_context('mode.use_inf_as_na', True):Correct:
Keep going
继续前进
Learn how to use your skills after completing the micro-course to create data visualizations in a final tutorial.
在完成微课程后,了解如何使用您的技能在 最终教程 中创建数据可视化。