In this notebook, we're going to be looking at how to scale and normalize data (and what the difference is between the two!).
在本笔记本中,我们将研究如何缩放和标准化数据(以及两者之间的区别!)。
Let's get started!
让我们开始吧!
Get our environment set up
设置我们的环境
The first thing we'll need to do is load in the libraries we'll be using.
我们需要做的第一件事是加载我们将使用的库。
# modules we'll use
import pandas as pd
import numpy as np

# for Box-Cox Transformation
from scipy import stats

# for min_max scaling
from mlxtend.preprocessing import minmax_scaling

# plotting modules
import seaborn as sns
import matplotlib.pyplot as plt

# set seed for reproducibility
np.random.seed(0)
Scaling vs. Normalization: What's the difference?
缩放与标准化:有什么区别?
One of the reasons that it's easy to get confused between scaling and normalization is because the terms are sometimes used interchangeably and, to make it even more confusing, they are very similar! In both cases, you're transforming the values of numeric variables so that the transformed data points have specific helpful properties. The difference is that:
缩放和标准化之间很容易混淆的原因之一是因为这些术语有时可以互换使用,而且更令人困惑的是,它们非常相似! 在这两种情况下,您都会转换数值变量的值,以便转换后的数据点具有特定的有用属性。 不同之处在于:
- in scaling, you're changing the range of your data, while
- 在缩放中,您正在更改数据的范围,而
- in normalization, you're changing the shape of the distribution of your data.
- 在标准化中,您正在更改数据的分布形状。
Let's talk a little more in-depth about each of these options.
让我们更深入地讨论一下每个选项。
Scaling
缩放
This means that you're transforming your data so that it fits within a specific scale, like 0-100 or 0-1. You want to scale data when you're using methods based on measures of how far apart data points are, like support vector machines (SVM) or k-nearest neighbors (KNN). With these algorithms, a change of "1" in any numeric feature is given the same importance.
这意味着您正在转换数据,使其适合特定的范围,例如 0-100 或 0-1。 当您使用基于数据点距离度量的方法时,您希望缩放数据,例如支持向量机 (SVM) 或 K - 最近邻(KNN)。 使用这些算法,任何数字特征中“1”的变化都被赋予相同的重要性。
For example, you might be looking at the prices of some products in both Yen and US Dollars. One US Dollar is worth about 100 Yen, but if you don't scale your prices, methods like SVM or KNN will consider a difference in price of 1 Yen as important as a difference of 1 US Dollar! This clearly doesn't fit with our intuitions of the world. With currency, you can convert between currencies. But what about if you're looking at something like height and weight? It's not entirely clear how many pounds should equal one inch (or how many kilograms should equal one meter).
例如,您可能会查看某些产品的日元和美元价格。 1 美元大约值 100 日元,但如果你不调整价格,SVM 或 KNN 等方法会认为 1 日元的价格差异与 1 美元的差异一样重要! 这显然不符合我们对世界的直觉。 使用货币,您可以在货币之间进行转换。 但是如果您要查看身高和体重之类的数据怎么办? 目前尚不完全清楚多少磅应等于一英寸(或多少公斤应等于一米)。
By scaling your variables, you can help compare different variables on equal footing. To help solidify what scaling looks like, let's look at a made-up example. (Don't worry, we'll work with real data in the following exercise!)
通过缩放变量,您可以在平等的基础上比较不同的变量。 为了帮助巩固缩放的外观,让我们看一个虚构的示例。 (别担心,我们将在接下来的练习中使用真实数据!)
# generate 1000 data points randomly drawn from an exponential distribution
original_data = np.random.exponential(size=1000)

# mix-max scale the data between 0 and 1
scaled_data = minmax_scaling(original_data, columns=[0])

# plot both together to compare
fig, ax = plt.subplots(1, 2, figsize=(15, 3))
sns.histplot(original_data, ax=ax[0], kde=True, legend=False)
ax[0].set_title("Original Data")
sns.histplot(scaled_data, ax=ax[1], kde=True, legend=False)
ax[1].set_title("Scaled data")
plt.show()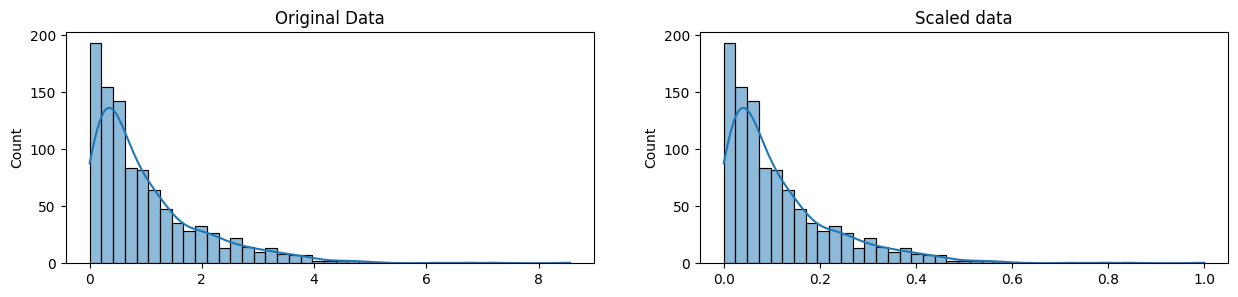
Notice that the shape of the data doesn't change, but that instead of ranging from 0 to 8ish, it now ranges from 0 to 1.
请注意,数据的形状没有改变,但范围不再是从 0 到 8,而是现在从 0 到 1。
Normalization
标准化
Scaling just changes the range of your data. Normalization is a more radical transformation. The point of normalization is to change your observations so that they can be described as a normal distribution.
缩放只会改变数据的范围。 标准化是一种更彻底的转变。 标准化的目的是改变您的观察结果,以便使他们符合正态分布。
Normal distribution: Also known as the "bell curve", this is a specific statistical distribution where a roughly equal observations fall above and below the mean, the mean and the median are the same, and there are more observations closer to the mean. The normal distribution is also known as the Gaussian distribution.
正态分布: 也称为
钟形曲线,这是一种特定的统计分布,其中大致相等的观察值落在 均值 周围,均值和中位数相同,接近均值的观测值较多。 正态分布也称为高斯分布。
In general, you'll normalize your data if you're going to be using a machine learning or statistics technique that assumes your data is normally distributed. Some examples of these include linear discriminant analysis (LDA) and Gaussian naive Bayes. (Pro tip: any method with "Gaussian" in the name probably assumes normality.)
一般来说,如果您要使用假设数据呈正态分布的机器学习或统计技术,则需要对数据进行标准化。 其中的一些示例包括线性判别分析 (LDA) 和高斯朴素贝叶斯。 (专业提示:任何名称中带有高斯的方法都可能假设正态分布。)
The method we're using to normalize here is called the Box-Cox Transformation. Let's take a quick peek at what normalizing some data looks like:
我们在这里用来标准化的方法称为 Box-Cox 变换。 让我们快速浏览一下一些数据的标准化是什么样子的:
# normalize the exponential data with boxcox
normalized_data = stats.boxcox(original_data)

# plot both together to compare
fig, ax=plt.subplots(1, 2, figsize=(15, 3))
sns.histplot(original_data, ax=ax[0], kde=True, legend=False)
ax[0].set_title("Original Data")
sns.histplot(normalized_data[0], ax=ax[1], kde=True, legend=False)
ax[1].set_title("Normalized data")
plt.show()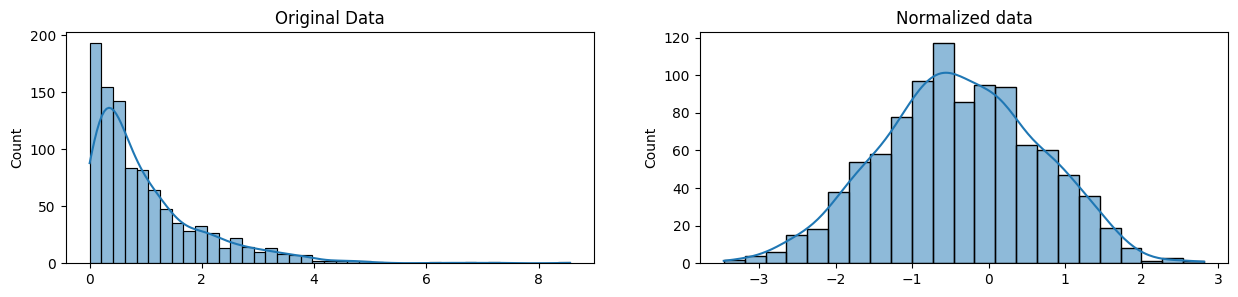
Notice that the shape of our data has changed. Before normalizing it was almost L-shaped. But after normalizing it looks more like the outline of a bell (hence "bell curve").
请注意,我们数据的形状已经改变。 在标准化之前它几乎是L形的。 但标准化后,它看起来更像钟形的轮廓(因此称为钟形曲线)。
Your turn
到你了
It's time to apply what you just learned a dataset of Kickstarter projects.
是时候对Kickstarter 项目的数据集应用您刚刚学到的知识 。