Introduction
介绍
So far, you've learned how to use several SQL clauses. For instance, you know how to use SELECT to pull specific columns from a table, along with WHERE to pull rows that meet specified criteria. You also know how to use aggregate functions like COUNT(), along with GROUP BY to treat multiple rows as a single group.
到目前为止,您已经学习了如何使用多个 SQL 子句。 例如,您知道如何使用 SELECT 从表中提取特定列,以及如何使用 WHERE 提取满足指定条件的行。 您还知道如何使用 COUNT() 等聚合函数以及 GROUP BY 将多行视为一个组。
Now you'll learn how to change the order of your results using the ORDER BY clause, and you'll explore a popular use case by applying ordering to dates. To illustrate what you'll learn in this tutorial, we'll work with a slightly modified version of our familiar pets table.
现在,您将学习如何使用 ORDER BY 子句更改结果的顺序,并且您将通过对日期应用排序来探索流行的用例。 为了说明您将在本教程中学到的内容,我们将使用我们熟悉的pets表的稍微修改的版本。

ORDER BY
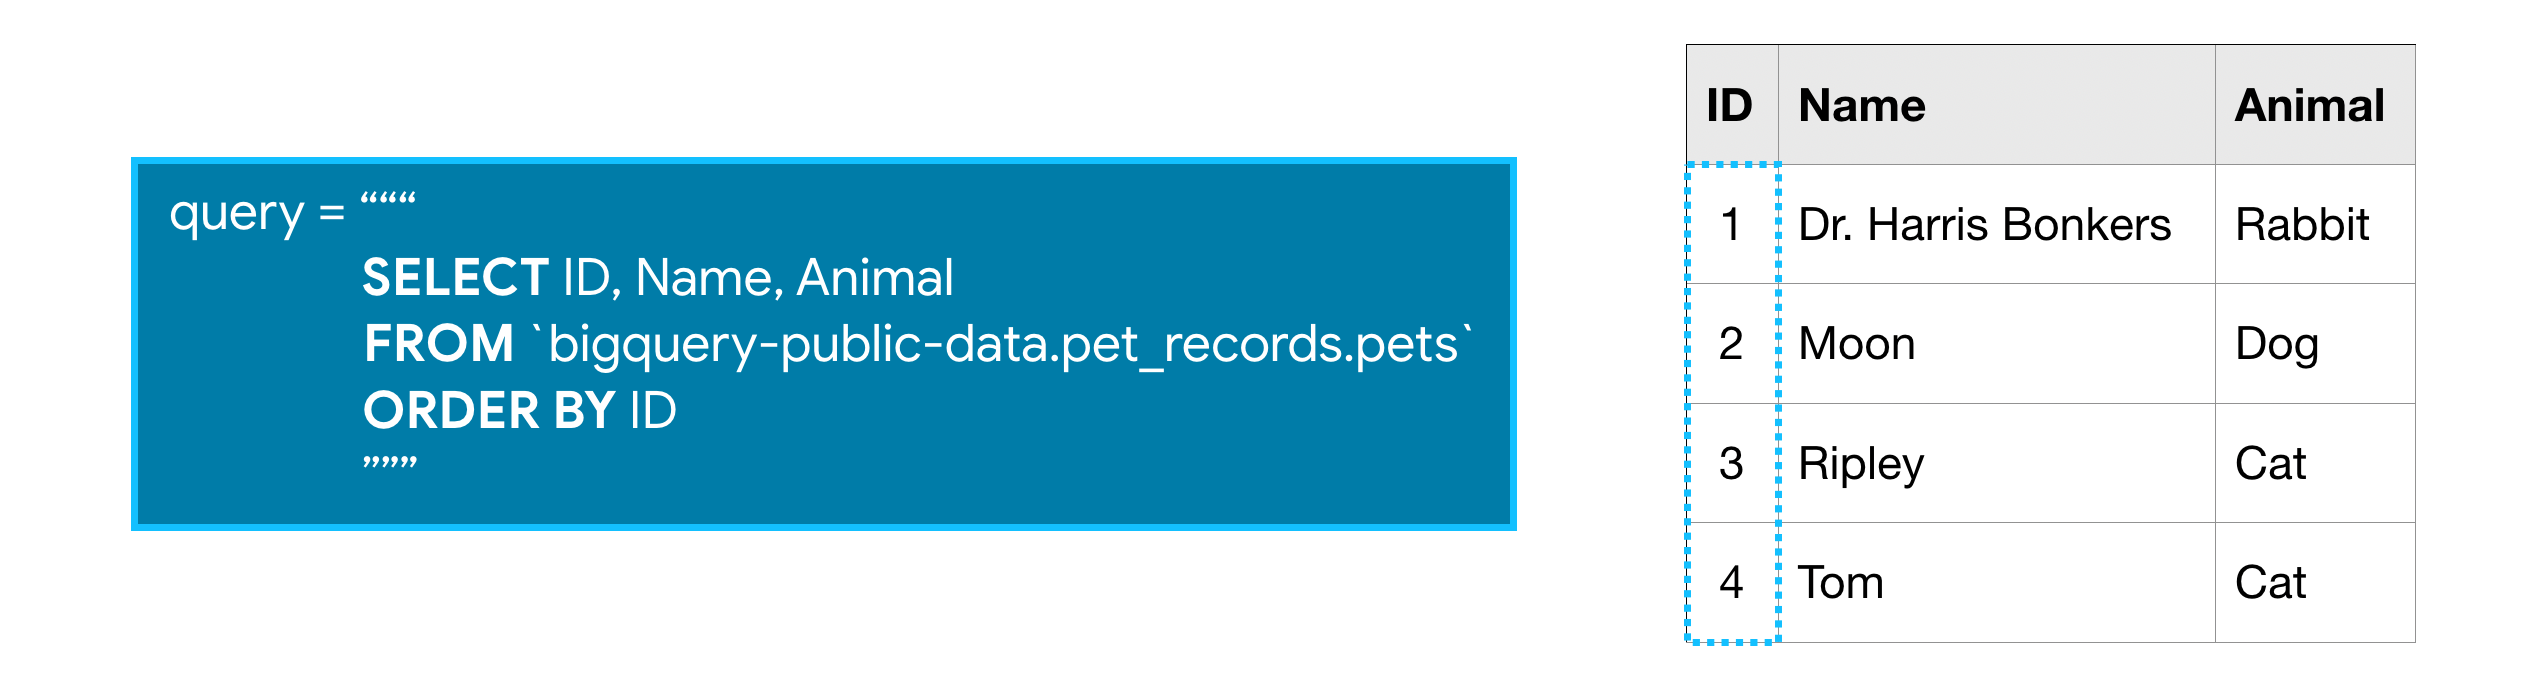
ORDER BY is usually the last clause in your query, and it sorts the results returned by the rest of your query.
ORDER BY 通常是查询中的最后一个子句,它对查询其余部分返回的结果进行排序。
Notice that the rows are not ordered by the ID column. We can quickly remedy this with the query below.
请注意,行不是按ID列排序的。 我们可以通过下面的查询快速解决这个问题。
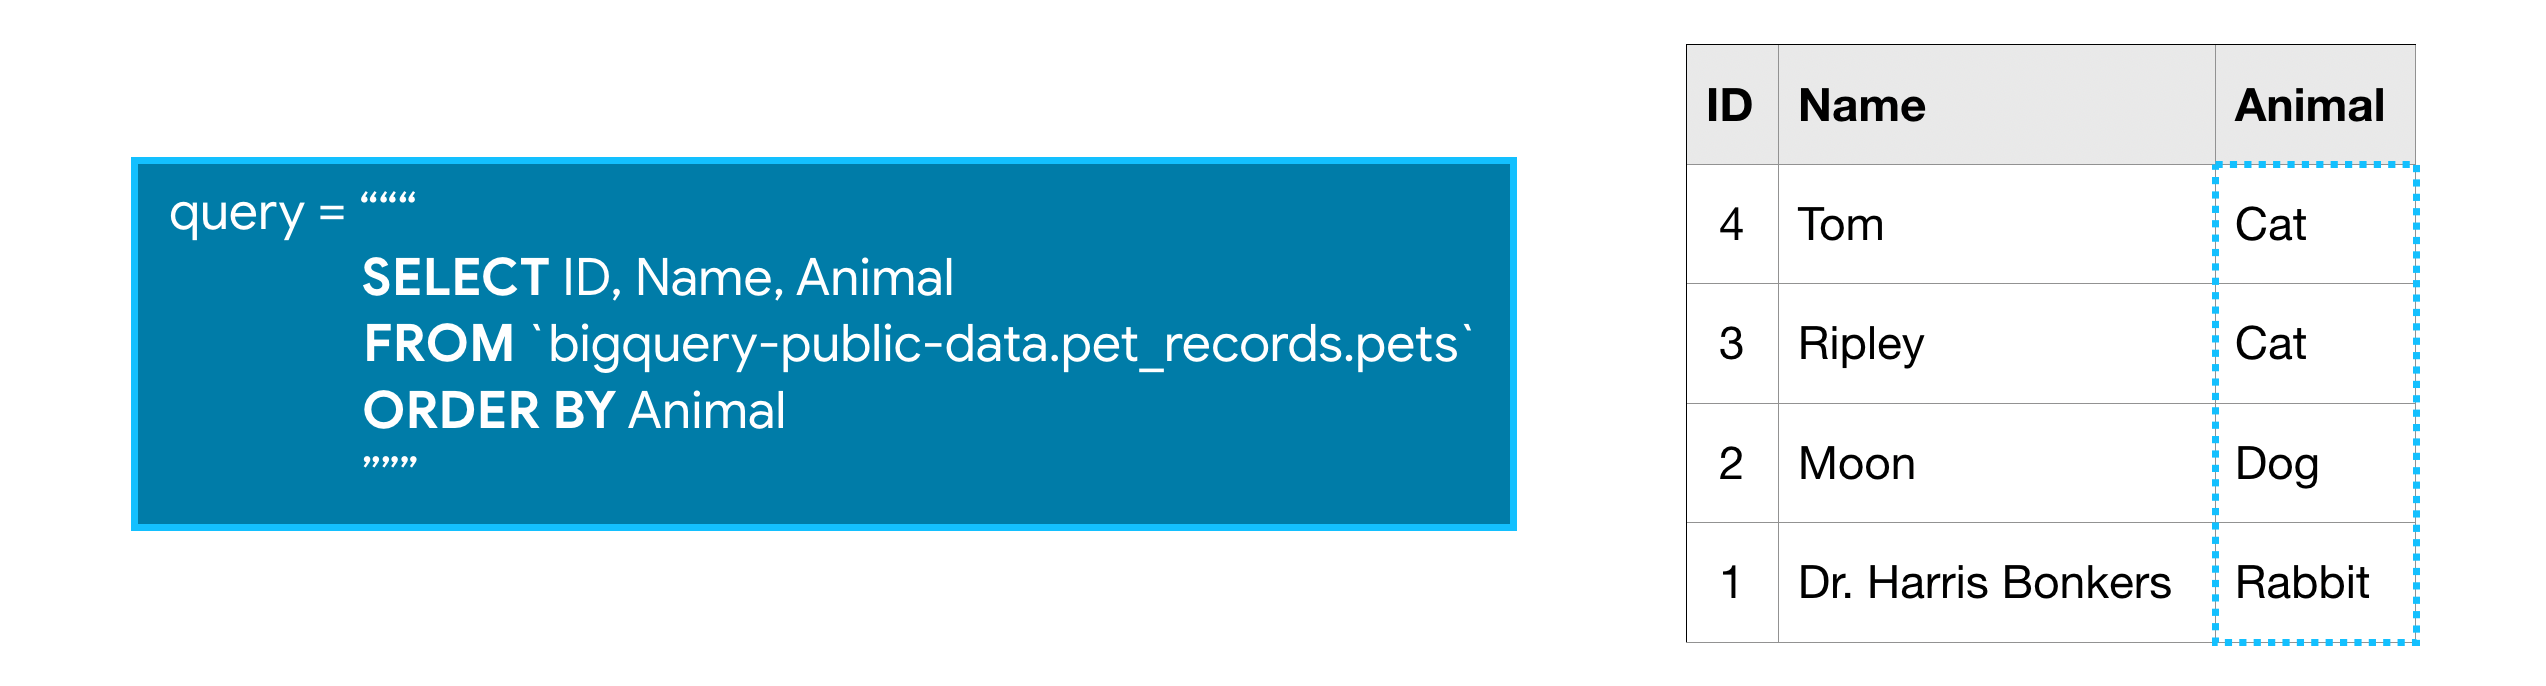
The ORDER BY clause also works for columns containing text, where the results show up in alphabetical order.
ORDER BY 子句也适用于包含文本的列,其中结果按字母顺序显示。
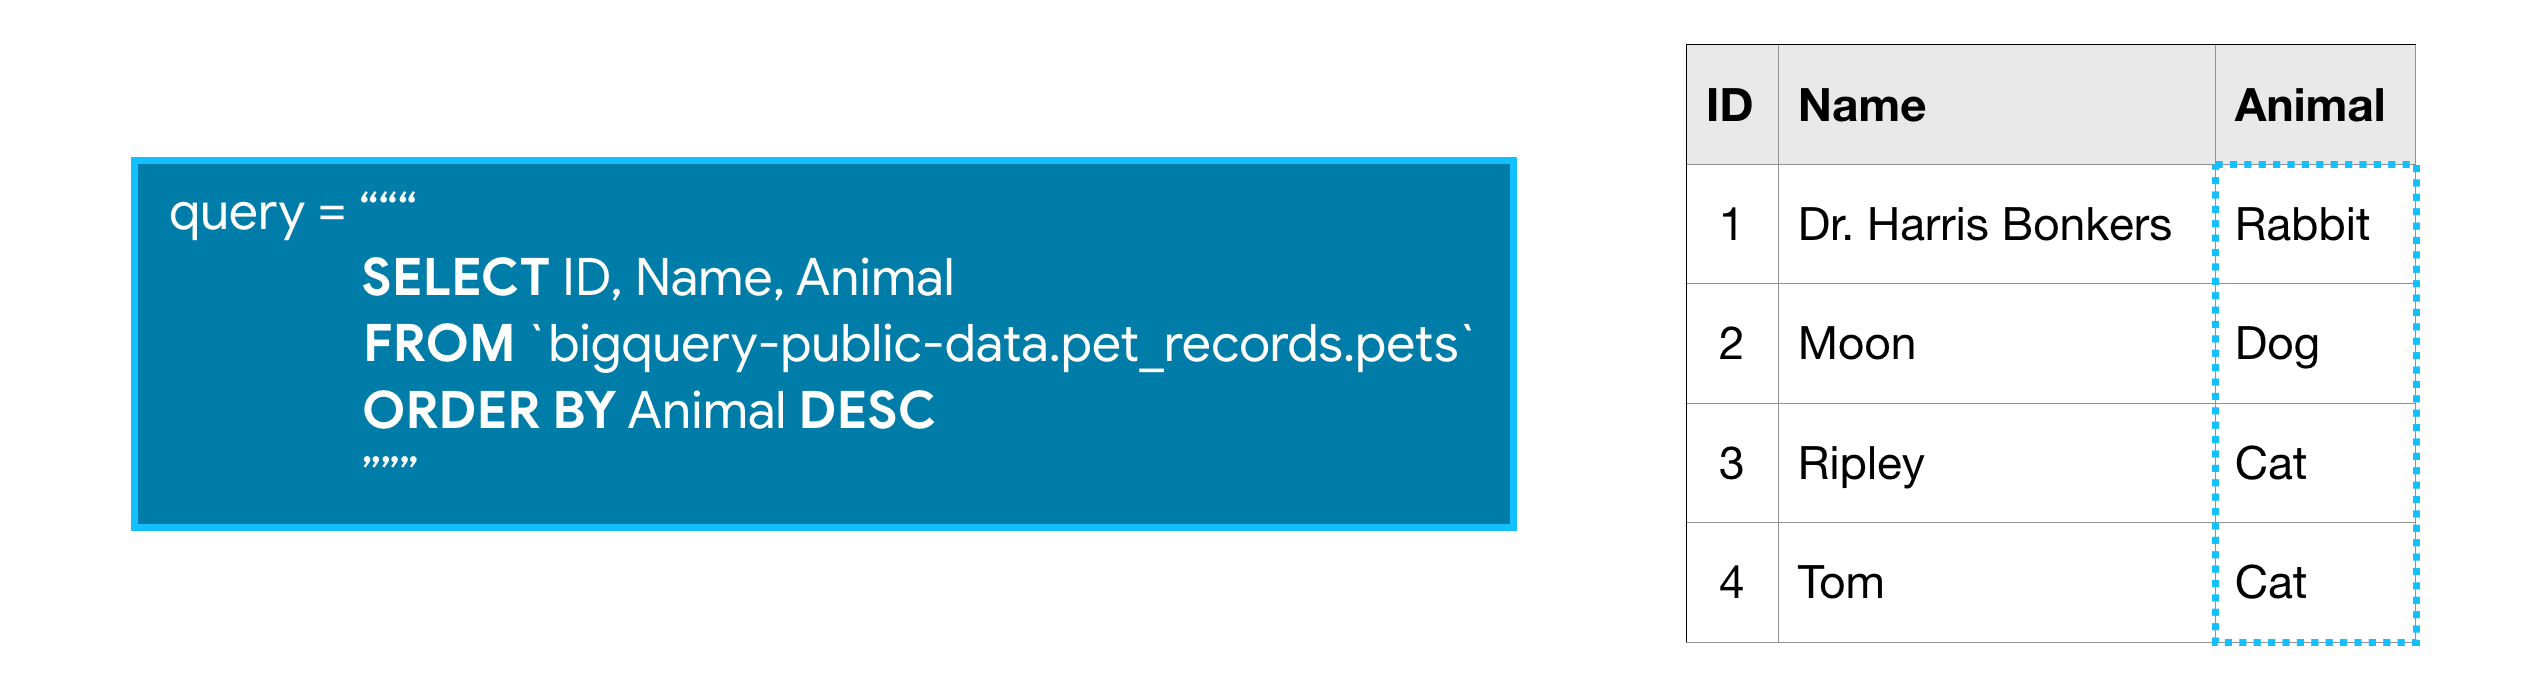
You can reverse the order using the DESC argument (short for 'descending'). The next query sorts the table by the Animal column, where the values that are last in alphabetic order are returned first.
您可以使用 DESC 参数(降序的缩写)反转顺序。 下一个查询按Animal列对表进行排序,其中按返回字母的逆序进行排序。
Dates
Next, we'll talk about dates, because they come up very frequently in real-world databases. There are two ways that dates can be stored in BigQuery: as a DATE or as a DATETIME.
接下来,我们将讨论日期,因为它们在现实世界的数据库中出现得非常频繁。 在 BigQuery 中可以通过两种方式存储日期:作为 DATE 或作为 DATETIME。
The DATE format has the year first, then the month, and then the day. It looks like this:
DATE 格式首先是年份,然后是月份,最后是日期。 它看起来像这样:
YYYY-[M]M-[D]DYYYY: Four-digit yearYYYY:四位数年份[M]M: One or two digit month[M]M:一位或两位数月份[D]D: One or two digit day[D]D:一位或两位数字的日期
So 2019-01-10 is interpreted as January 10, 2019.
因此2019-01-10被解释为 2019 年 1 月 10 日。
The DATETIME format is like the date format ... but with time added at the end.
DATETIME 格式类似于日期格式...但在末尾添加了时间。
EXTRACT
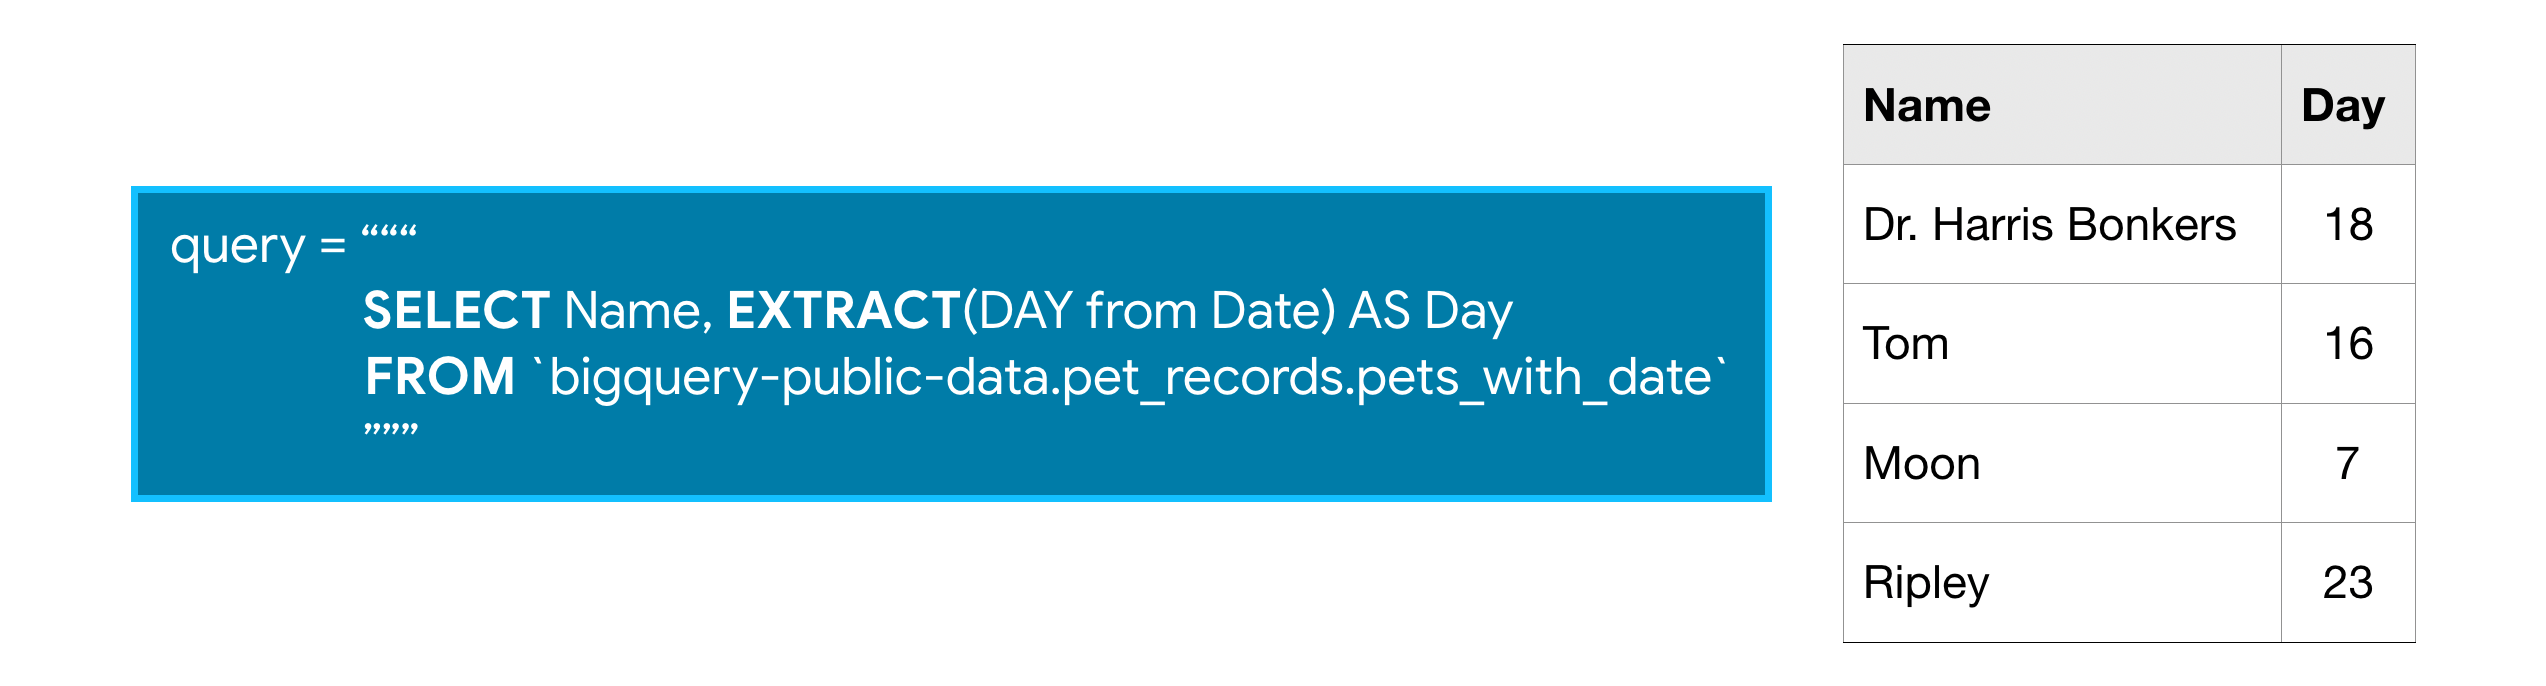
Often you'll want to look at part of a date, like the year or the day. You can do this with EXTRACT. We'll illustrate this with a slightly different table, called pets_with_date.
通常您会想要查看日期的一部分,例如年份或日期。 您可以使用 EXTRACT 来完成此操作。 我们将用一个稍微不同的表来说明这一点,称为pets_with_date。

The query below returns two columns, where column Day contains the day corresponding to each entry the Date column from the pets_with_date table:
下面的查询返回两列,其中Day列包含与pets_with_date表中Date列的每个条目对应的日期:
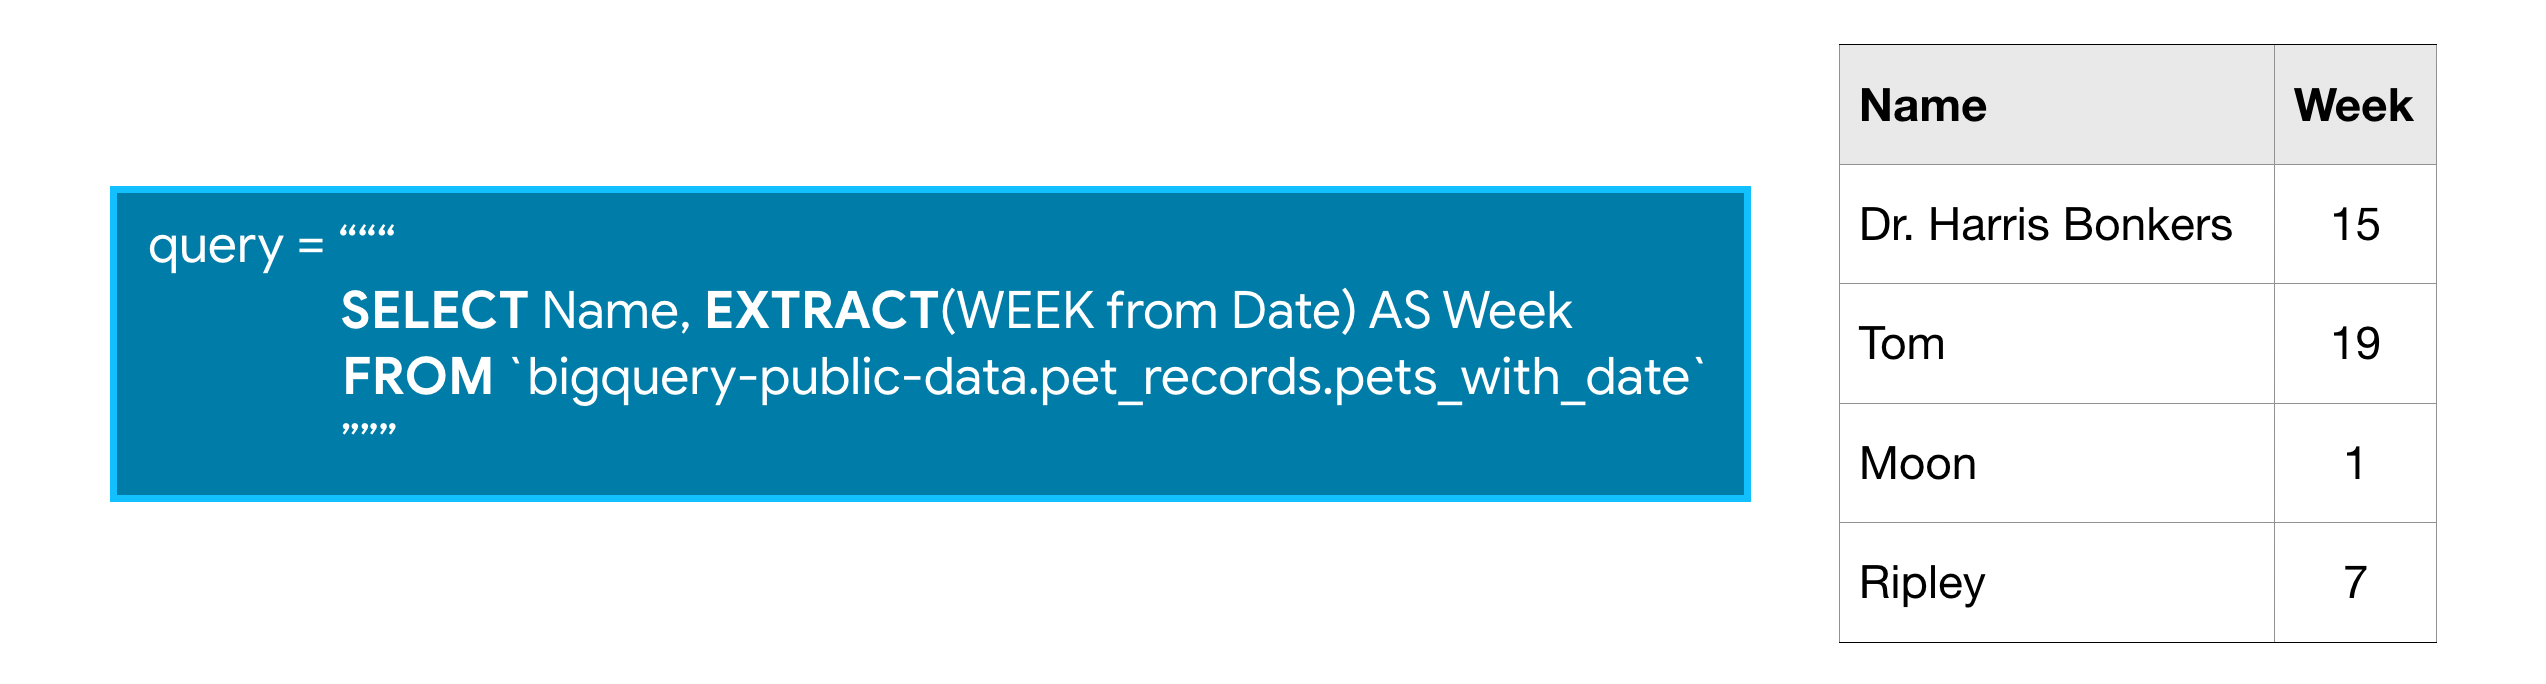
SQL is very smart about dates, and we can ask for information beyond just extracting part of the cell. For example, this query returns one column with just the week in the year (between 1 and 53) for each date in the Date column:
SQL 对于日期的处理非常智能,我们可以查询除提取部分单元格之外的信息。 例如,此查询为Date列中的每个日期返回一列,其中仅包含一年中的第几周(介于 1 到 53 之间):
You can find all the functions you can use with dates in BigQuery in this documentation under "Date and time functions".
您可以在本文档的日期和时间函数下找到可在 BigQuery 中与日期一起使用的所有函数。
Example: Which day of the week has the most fatal motor accidents?
示例:一周中哪一天致命车祸最多?
Let's use the US Traffic Fatality Records database, which contains information on traffic accidents in the US where at least one person died.
让我们使用美国交通死亡记录数据库,该数据库包含美国发生至少一人死亡的交通事故信息。
We'll investigate the accident_2015 table. Here is a view of the first few rows. (We have hidden the corresponding code. To take a peek, click on the "Code" button below.)
我们将查看accident_2015表。 这是前几行的视图。 (_我们已经隐藏了相应的代码。要查看,请点击下面的MARKDOWN_HASH06e004ef21414c06d3e4ff2cefaf6a04MARKDOWNHASH按钮。)
from google.cloud import bigquery

# Create a "Client" object
client = bigquery.Client()

# Construct a reference to the "nhtsa_traffic_fatalities" dataset
dataset_ref = client.dataset("nhtsa_traffic_fatalities", project="bigquery-public-data")

# API request - fetch the dataset
dataset = client.get_dataset(dataset_ref)

# Construct a reference to the "accident_2015" table
table_ref = dataset_ref.table("accident_2015")

# API request - fetch the table
table = client.get_table(table_ref)

# Preview the first five lines of the "accident_2015" table
client.list_rows(table, max_results=5).to_dataframe()
/home/codespace/.python/current/lib/python3.10/site-packages/google/auth/_default.py:76: UserWarning: Your application has authenticated using end user credentials from Google Cloud SDK without a quota project. You might receive a "quota exceeded" or "API not enabled" error. See the following page for troubleshooting: https://cloud.google.com/docs/authentication/adc-troubleshooting/user-creds.
warnings.warn(_CLOUD_SDK_CREDENTIALS_WARNING)
/home/codespace/.python/current/lib/python3.10/site-packages/google/auth/_default.py:76: UserWarning: Your application has authenticated using end user credentials from Google Cloud SDK without a quota project. You might receive a "quota exceeded" or "API not enabled" error. See the following page for troubleshooting: https://cloud.google.com/docs/authentication/adc-troubleshooting/user-creds.
warnings.warn(_CLOUD_SDK_CREDENTIALS_WARNING)| state_number | state_name | consecutive_number | number_of_vehicle_forms_submitted_all | number_of_motor_vehicles_in_transport_mvit | number_of_parked_working_vehicles | number_of_forms_submitted_for_persons_not_in_motor_vehicles | number_of_persons_not_in_motor_vehicles_in_transport_mvit | number_of_persons_in_motor_vehicles_in_transport_mvit | number_of_forms_submitted_for_persons_in_motor_vehicles | ... | minute_of_ems_arrival_at_hospital | related_factors_crash_level_1 | related_factors_crash_level_1_name | related_factors_crash_level_2 | related_factors_crash_level_2_name | related_factors_crash_level_3 | related_factors_crash_level_3_name | number_of_fatalities | number_of_drunk_drivers | timestamp_of_crash | |
|---|---|---|---|---|---|---|---|---|---|---|---|---|---|---|---|---|---|---|---|---|---|
| 0 | 30 | Montana | 300019 | 5 | 5 | 0 | 0 | 0 | 7 | 7 | ... | 45 | 0 | None | 0 | None | 0 | None | 1 | 0 | 2015-03-28 14:58:00+00:00 |
| 1 | 39 | Ohio | 390099 | 7 | 7 | 0 | 0 | 0 | 15 | 15 | ... | 24 | 27 | Backup Due to Prior Crash | 0 | None | 0 | None | 1 | 0 | 2015-02-14 11:19:00+00:00 |
| 2 | 49 | Utah | 490123 | 16 | 16 | 0 | 0 | 0 | 28 | 28 | ... | 99 | 0 | None | 0 | None | 0 | None | 1 | 0 | 2015-04-14 12:24:00+00:00 |
| 3 | 48 | Texas | 481184 | 6 | 5 | 1 | 0 | 5 | 5 | 10 | ... | 99 | 0 | None | 0 | None | 0 | None | 1 | 0 | 2015-05-27 16:40:00+00:00 |
| 4 | 41 | Oregon | 410333 | 11 | 11 | 0 | 0 | 0 | 14 | 14 | ... | 99 | 0 | None | 0 | None | 0 | None | 1 | 0 | 2015-11-17 18:17:00+00:00 |
5 rows × 70 columns
Let's use the table to determine how the number of accidents varies with the day of the week. Since:
让我们使用该表来确定事故数量随星期几的变化情况。 已知:
- the
consecutive_numbercolumn contains a unique ID for each accident, and consecutive_number列包含每个事故的唯一 ID,并且- the
timestamp_of_crashcolumn contains the date of the accident in DATETIME format, timestamp_of_crash列包含 DATETIME 格式的事故日期,
we can:
我们可以:
- EXTRACT the day of the week (as
day_of_weekin the query below) from thetimestamp_of_crashcolumn, and - 从
timestamp_of_crash列中EXTRACT星期几(命名为下面查询中的day_of_week),以及 - GROUP BY the day of the week, before we COUNT the
consecutive_numbercolumn to determine the number of accidents for each day of the week. - 按星期几进行GROUP BY,然后我们 COUNT
consecutive_number列来确定一周中每一天的事故数量。
Then we sort the table with an ORDER BY clause, so the days with the most accidents are returned first.
然后我们使用 ORDER BY 子句对表进行排序,首先返回事故最多的日子。
# Query to find out the number of accidents for each day of the week
query = """
        SELECT COUNT(consecutive_number) AS num_accidents,
               EXTRACT(DAYOFWEEK FROM timestamp_of_crash) AS day_of_week
        FROM `bigquery-public-data.nhtsa_traffic_fatalities.accident_2015`
        GROUP BY day_of_week
        ORDER BY num_accidents DESC
        """
As usual, we run it as follows:
像往常一样,我们按如下方式运行它:
# Set up the query (cancel the query if it would use too much of
# your quota, with the limit set to 1 GB)
safe_config = bigquery.QueryJobConfig(maximum_bytes_billed=10**9)
query_job = client.query(query, job_config=safe_config)

# API request - run the query, and convert the results to a pandas DataFrame
accidents_by_day = query_job.to_dataframe()

# Print the DataFrame
accidents_by_day| num_accidents | day_of_week | |
|---|---|---|
| 0 | 5659 | 7 |
| 1 | 5298 | 1 |
| 2 | 4916 | 6 |
| 3 | 4460 | 5 |
| 4 | 4182 | 4 |
| 5 | 4038 | 2 |
| 6 | 3985 | 3 |
Notice that the data is sorted by the num_accidents column, where the days with more traffic accidents appear first.
请注意,数据按num_accidents列排序,其中交通事故较多的日子首先出现。
To map the numbers returned for the day_of_week column to the actual day, you might consult the BigQuery documentation on the DAYOFWEEK function. It says that it returns "an integer between 1 (Sunday) and 7 (Saturday), inclusively". So, in 2015, most fatal motor accidents in the US occured on Sunday and Saturday, while the fewest happened on Tuesday.
要将day_of_week列返回的数字映射到实际日期,您可以查阅 BigQuery 文档 中的 DAYOFWEEK 函数。 它返回1(星期日)和 7(星期六)之间的整数,包括 1(星期日)和 7(星期六)。 因此,2015年美国致命车祸最多发生在周日和周六,而最少发生在周二。
Your Turn
到你了
ORDER BY can make your results easier to interpret. Try it yourself.
ORDER BY 可以使您的结果更易于解释。 自己尝试一下 。