This notebook is an exercise in the AI Ethics course. You can reference the tutorial at this link.
In the tutorial, you learned about different ways of measuring fairness of a machine learning model. In this exercise, you'll train a few models to approve (or deny) credit card applications and analyze fairness. Don't worry if you're new to coding: this exercise assumes no programming knowledge.
在本教程中,您了解了衡量机器学习模型公平性的不同方法。在本练习中,您将训练一些模型来批准(或拒绝)信用卡申请并分析公平性。如果您是编码新手,请不要担心:本练习不需要任何编程知识。
Introduction
简介
We work with a synthetic dataset of information submitted by credit card applicants.
我们使用信用卡申请人提交的合成信息数据集。
To load and preview the data, run the next code cell. When the code finishes running, you should see a message saying the data was successfully loaded, along with a preview of the first five rows of the data.
要加载和预览数据,请运行下一个代码单元。代码运行完成后,您应该会看到一条消息,提示数据已成功加载,以及数据的前五行预览。
# Set up feedback system
from learntools.core import binder
binder.bind(globals())
from learntools.ethics.ex4 import *
import pandas as pd
from sklearn.model_selection import train_test_split

# Load the data, separate features from target
data = pd.read_csv("../input/synthetic-credit-card-approval/synthetic_credit_card_approval.csv")
X = data.drop(["Target"], axis=1)
y = data["Target"]

# Break into training and test sets
X_train, X_test, y_train, y_test = train_test_split(X, y, train_size=0.8, test_size=0.2, random_state=0)

# Preview the data
print("Data successfully loaded!\n")
X_train.head()
Data successfully loaded!| Num_Children | Group | Income | Own_Car | Own_Housing | |
|---|---|---|---|---|---|
| 288363 | 1 | 1 | 40690 | 0 | 1 |
| 64982 | 2 | 0 | 75469 | 1 | 0 |
| 227641 | 1 | 1 | 70497 | 1 | 1 |
| 137672 | 1 | 1 | 61000 | 0 | 0 |
| 12758 | 1 | 1 | 56666 | 1 | 1 |
The dataset contains, for each applicant:
对于每个申请人,数据集包含:
- income (in the
Incomecolumn), - 收入(在
收入列中), - the number of children (in the
Num_Childrencolumn), - 子女数(在
儿童数量列中), - whether the applicant owns a car (in the
Own_Carcolumn, the value is1if the applicant owns a car, and is else0), and - 申请人是否拥有汽车(在
Own_Car列中,如果申请人拥有汽车,则值为1,否则为0),以及 - whether the applicant owns a home (in the
Own_Housingcolumn, the value is1if the applicant owns a home, and is else0) - 申请人是否拥有房屋(在
Own_Housing列中,如果申请人拥有房屋,则值为1,否则为0)
When evaluating fairness, we'll check how the model performs for users in different groups, as identified by the Group column:
在评估公平性时,我们将检查模型对不同组中的用户的表现,如组列所示:
- The
Groupcolumn breaks the users into two groups (where each group corresponds to either0or1). 组列将用户分为两组(每组对应0或1)。- For instance, you can think of the column as breaking the users into two different races, ethnicities, or gender groupings. If the column breaks users into different ethnicities,
0could correspond to a non-Hispanic user, while1corresponds to a Hispanic user. - 例如,您可以将该列视为将用户分为两个不同的种族、民族或性别组。如果该列将用户分为不同的种族,则
0可能对应于非西班牙裔用户,而1对应于西班牙裔用户。
Run the next code cell without changes to train a simple model to approve or deny individuals for a credit card. The output shows the performance of the model.
运行下一个代码单元(无需更改)以训练一个简单的模型来批准或拒绝个人的信用卡。输出显示模型的性能。
from sklearn import tree
from sklearn.metrics import confusion_matrix, ConfusionMatrixDisplay
import matplotlib.pyplot as plt

# Train a model and make predictions
model_baseline = tree.DecisionTreeClassifier(random_state=5, max_depth=3)
model_baseline.fit(X_train, y_train)
preds_baseline = model_baseline.predict(X_test)

# Function to plot confusion matrix
def plot_confusion_matrix(estimator, X, y_true, y_pred, display_labels=["Deny", "Approve"],
                          include_values=True, xticks_rotation='horizontal', values_format='',
                          normalize=None, cmap=plt.cm.Blues):
    cm = confusion_matrix(y_true, y_pred, normalize=normalize)
    disp = ConfusionMatrixDisplay(confusion_matrix=cm, display_labels=display_labels)
    return cm, disp.plot(include_values=include_values, cmap=cmap, xticks_rotation=xticks_rotation,
                     values_format=values_format)

# Function to evaluate the fairness of the model
def get_stats(X, y, model, group_one, preds):

    y_zero, preds_zero, X_zero = y[group_one==False], preds[group_one==False], X[group_one==False]
    y_one, preds_one, X_one = y[group_one], preds[group_one], X[group_one]

    print("Total approvals:", preds.sum())
    print("Group A:", preds_zero.sum(), "({}% of approvals)".format(round(preds_zero.sum()/sum(preds)*100, 2)))
    print("Group B:", preds_one.sum(), "({}% of approvals)".format(round(preds_one.sum()/sum(preds)*100, 2)))

    print("\nOverall accuracy: {}%".format(round((preds==y).sum()/len(y)*100, 2)))
    print("Group A: {}%".format(round((preds_zero==y_zero).sum()/len(y_zero)*100, 2)))
    print("Group B: {}%".format(round((preds_one==y_one).sum()/len(y_one)*100, 2)))

    cm_zero, disp_zero = plot_confusion_matrix(model, X_zero, y_zero, preds_zero)
    disp_zero.ax_.set_title("Group A")
    cm_one, disp_one = plot_confusion_matrix(model, X_one, y_one, preds_one)
    disp_one.ax_.set_title("Group B")

    print("\nSensitivity / True positive rate:")
    print("Group A: {}%".format(round(cm_zero[1,1] / cm_zero[1].sum()*100, 2)))
    print("Group B: {}%".format(round(cm_one[1,1] / cm_one[1].sum()*100, 2)))

# Evaluate the model
get_stats(X_test, y_test, model_baseline, X_test["Group"]==1, preds_baseline)
Total approvals: 38246
Group A: 8028 (20.99% of approvals)
Group B: 30218 (79.01% of approvals)
Overall accuracy: 94.79%
Group A: 94.56%
Group B: 95.02%
Sensitivity / True positive rate:
Group A: 77.23%
Group B: 98.03%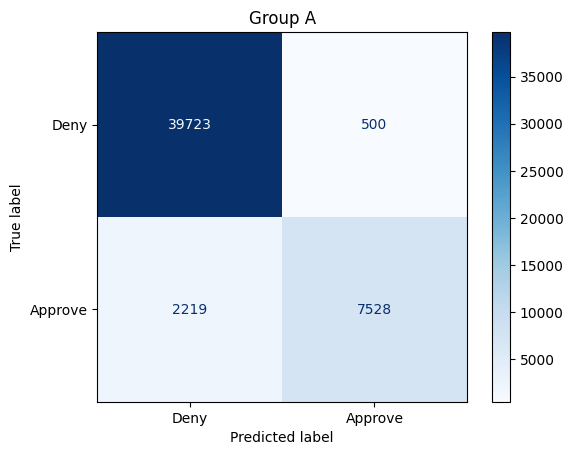
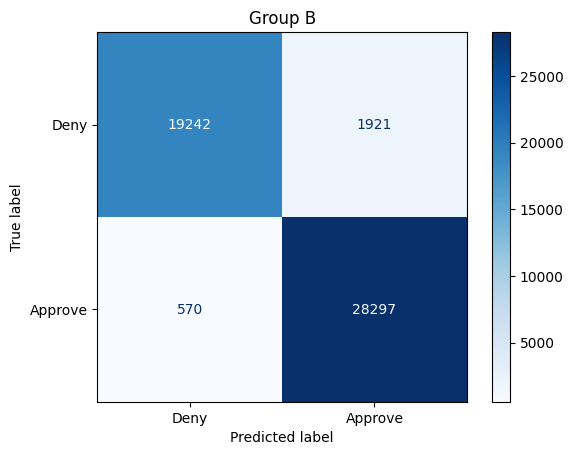
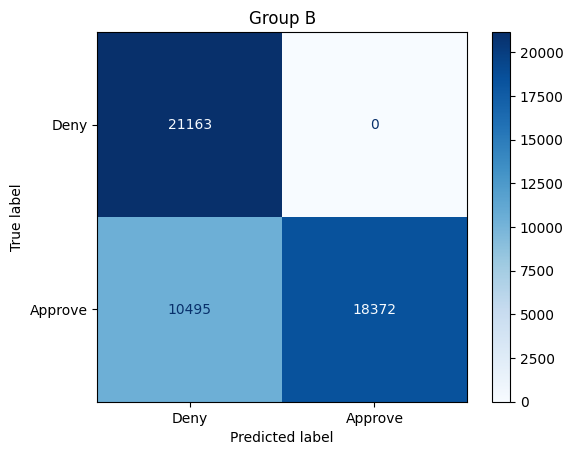
The confusion matrices above show how the model performs on some test data. We also print additional information (calculated from the confusion matrices) to assess fairness of the model. For instance,
上面的混淆矩阵显示了模型在某些测试数据上的表现。我们还打印了其他信息(根据混淆矩阵计算得出)以评估模型的公平性。例如,
- The model approved 38246 people for a credit card. Of these individuals, 8028 belonged to Group A, and 30218 belonged to Group B.
- 该模型批准了 38246 人的信用卡申请。其中,8028 人属于 A 组,30218 人属于 B 组。
- The model is 94.56% accurate for Group A, and 95.02% accurate for Group B. These percentages can be calculated directly from the confusion matrix; for instance, for Group A, the accuracy is (39723+7528)/(39723+500+2219+7528).
- 该模型对 A 组的准确率为 94.56%,对 B 组的准确率为 95.02%。这些百分比可以直接从混淆矩阵中计算出来;例如,对于 A 组,准确率为 (39723+7528)/(39723+500+2219+7528)。
- The true positive rate (TPR) for Group A is 77.23%, and the TPR for Group B is 98.03%. These percentages can be calculated directly from the confusion matrix; for instance, for Group A, the TPR is 7528/(7528+2219).
- A 组的真实阳性率 (TPR) 为 77.23%,B 组的 TPR 为 98.03%。这些百分比可以直接从混淆矩阵中计算出来;例如,对于 A 组,TPR 为 7528/(7528+2219)。
1) Varieties of fairness
1) 公平性的种类
Consider three different types of fairness covered in the tutorial:
考虑本教程中涵盖的三种不同类型的公平性:
- Demographic parity: Which group has an unfair advantage, with more representation in the group of approved applicants? (Roughly 50% of applicants are from Group A, and 50% of applicants are from Group B.)
- 人口平等:哪个群体具有不公平的优势,在获批申请人群体中具有更多代表性?(大约 50% 的申请人来自 A 组,50% 的申请人来自 B 组。)
- Equal accuracy: Which group has an unfair advantage, where applicants are more likely to be correctly classified?
- 平等准确度:哪个群体具有不公平的优势,申请人更有可能被正确分类?
- Equal opportunity: Which group has an unfair advantage, with a higher true positive rate?
- 平等机会:哪个群体具有不公平的优势,具有更高的真实阳性率?
# Check your answer (Run this code cell to get credit!)
q_1.check()
Solution: All of the fairness criteria are unfairly biased in favor of Group B. 79.01% of applicants are from Group B -- if demographic parity is our fairness criterion, fair would mean that 50% of the applicants are from Group B. The model is also slightly more accurate for applicants from Group B (with accuracy of 95.02%, vs 94.56% for Group A). The true positive rate is very high for Group B (98.03%, vs. 77.23% for Group A). In other words, for Group B, almost all people who should be approved are actually approved. For Group A, if you should be approved, your chances of actually being approved are much lower.
所有公平标准都偏向 B 组,这很不公平。79.01% 的申请人来自 B 组——如果人口均等是我们的公平标准,那么公平意味着 50% 的申请人来自 B 组。该模型对 B 组申请人的准确率也略高一些(准确率为 95.02%,而 A 组为 94.56%)。B 组的真实阳性率非常高(98.03%,而 A 组为 77.23%)。换句话说,对于 B 组,几乎所有应该获得批准的人实际上都获得了批准。对于 A 组,如果您应该获得批准,那么您实际获得批准的机会要低得多。
Run the next code cell without changes to visualize the model.
运行下一个代码单元(无需进行任何更改)来可视化模型。
def visualize_model(model, feature_names, class_names=["Deny", "Approve"], impurity=False):
    plot_list = tree.plot_tree(model, feature_names=feature_names, class_names=class_names, impurity=impurity)
    [process_plot_item(item) for item in plot_list]

def process_plot_item(item):
    split_string = item.get_text().split("\n")
    if split_string[0].startswith("samples"):
        item.set_text(split_string[-1])
    else:
        item.set_text(split_string[0])

plt.figure(figsize=(20, 6))
plot_list = visualize_model(model_baseline, feature_names=X_train.columns)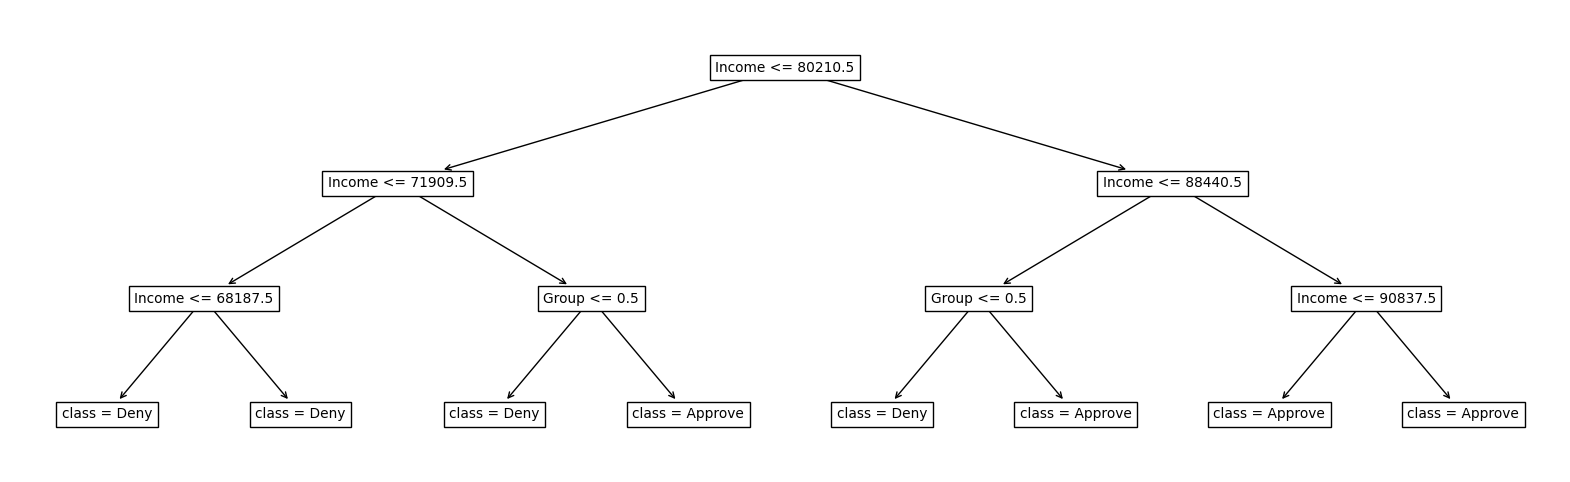
The flowchart shows how the model makes decisions:
流程图显示了模型如何做出决策:
Group <= 0.5checks what group the applicant belongs to: if the applicant belongs to Group A, thenGroup <= 0.5is true.Group <= 0.5检查申请人属于哪个组:如果申请人属于 A 组,则Group <= 0.5为真。- Entries like
Income <= 80210.5check the applicant's income. Income <= 80210.5等条目检查申请人的收入。
To follow the flow chart, we start at the top and trace a path depending on the details of the applicant. If the condition is true at a split, then we move down and to the left branch. If it is false, then we move to the right branch.
要遵循流程图,我们从顶部开始,并根据申请人的详细信息追踪路径。 如果条件在拆分时为真,则我们向下移动到左侧分支。 如果为假,则我们移动到右侧分支。
For instance, consider an applicant in Group B, who has an income of 75k. Then,
例如,考虑 B 组中的申请人,其收入为 75k。 然后,
- We start at the top of the flow chart. the applicant has an income of 75k, so
Income <= 80210.5is true, and we move to the left. - 我们从流程图的顶部开始。 申请人的收入为 75k,因此
Income <= 80210.5为真,我们向左移动。 - Next, we check the income again. Since
Income <= 71909.5is false, we move to the right. - 接下来,我们再次检查收入。 由于
Income <= 71909.5为假,我们向右移动。 - The last thing to check is what group the applicant belongs to. The applicant belongs to Group B, so
Group <= 0.5is false, and we move to the right, where the model has decided to approve the applicant. - 最后要检查的是申请人属于哪个组。申请人属于 B 组,因此
Group <= 0.5为假,我们向右移动,模型已决定批准申请人。
2) Understand the baseline model
2) 了解基线模型
Based on the visualization, how can you explain one source of unfairness in the model?
根据可视化,您如何解释模型中不公平的一个来源?
Hint: Consider the example applicant, but change the group membership from Group B to Group A (leaving all other characteristics the same). Is this slightly different applicant approved or denied by the model?
提示:考虑示例申请人,但将组成员身份从 B 组更改为 A 组(保持所有其他特征不变)。这个略有不同的申请人是否被模型批准或拒绝?
# Check your answer (Run this code cell to get credit!)
q_2.check()
Solution: For all applicants with income between 71909.5 and 88440.5, the model's decision depends on group membership: the model approves applicants from Group B and denies applicants from Group A. Since we want the model to treat individuals from Group A and Group B fairly, this is clearly a bad model. Although this data is very simple, in practice, with much larger data, visualizing the how a model makes decisions can be very useful to more deeply understand what might be going wrong with a model.
对于收入在 71909.5 至 88440.5 之间的所有申请人,模型的决策取决于组别:模型批准 B 组的申请人,拒绝 A 组的申请人。由于我们希望模型公平对待 A 组和 B 组的个人,因此这显然是一个糟糕的模型。虽然这些数据非常简单,但在实践中,如果数据量大得多,可视化模型如何做出决策可能非常有用,可以更深入地了解模型可能出现的问题。
Next, you decide to remove group membership from the training data and train a new model. Do you think this will make the model treat the groups more equally?
接下来,您决定从训练数据中删除群组成员身份并训练新模型。您认为这会让模型更平等地对待各个群组吗?
Run the next code cell to see how this new group unaware model performs.
运行下一个代码单元,看看这个新的群组不知情模型的表现如何。
# Create new dataset with gender removed
X_train_unaware = X_train.drop(["Group"],axis=1)
X_test_unaware = X_test.drop(["Group"],axis=1)

# Train new model on new dataset
model_unaware = tree.DecisionTreeClassifier(random_state=0, max_depth=3)
model_unaware.fit(X_train_unaware, y_train)

# Evaluate the model
preds_unaware = model_unaware.predict(X_test_unaware)
get_stats(X_test_unaware, y_test, model_unaware, X_test["Group"]==1, preds_unaware)
Total approvals: 36670
Group A: 11624 (31.7% of approvals)
Group B: 25046 (68.3% of approvals)
Overall accuracy: 92.66%
Group A: 93.61%
Group B: 91.72%
Sensitivity / True positive rate:
Group A: 93.24%
Group B: 86.21%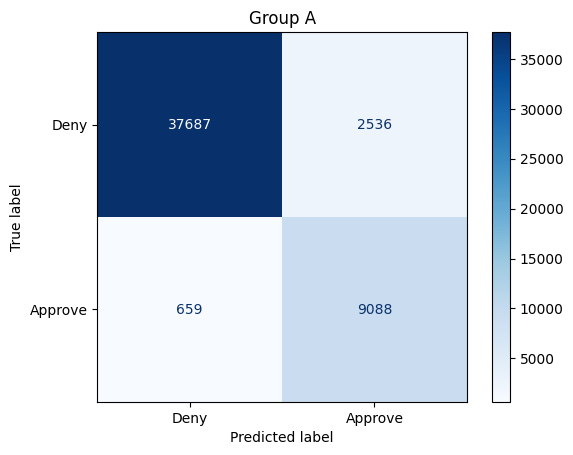
3) Varieties of fairness, part 2
3) 公平性的多样性,第 2 部分
How does this model compare to the first model you trained, when you consider demographic parity, equal accuracy, and equal opportunity? Once you have an answer, run the next code cell.
当您考虑人口平等、同等准确度和平等机会时,此模型与您训练的第一个模型相比如何?一旦您有了答案,请运行下一个代码单元。
# Check your answer (Run this code cell to get credit!)
q_3.check()
Solution: When we consider demographic parity, the new model is still biased in favor of Group B, but is now a bit more fair than the original model. But now, if you consider either equal accuracy or equal opportunity, the model is biased in favor of Group A! It's also important to note that the overall accuracy of the model has dropped -- for each group, the model is making slightly less accurate decisions.
当我们考虑人口统计学差异时,新模型仍然偏向于 B 组,但现在比原始模型更公平一些。但现在,如果您考虑同等准确性或同等机会,该模型就会偏向于 A 组!同样值得注意的是,模型的整体准确性有所下降——对于每个组,模型做出的决策都略有下降。
You decide to train a third potential model, this time with the goal of having each group have even representation in the group of approved applicants. (This is an implementation of group thresholds, which you can optionally read more about here.)
您决定训练第三个潜在模型,这次的目标是让每个组在获批申请人组中具有均等的代表性。(这是组阈值的实现,您可以选择在此处 了解更多信息。)
Run the next code cell without changes to evaluate this new model.
运行下一个代码单元(不做任何更改)以评估这个新模型。
# Change the value of zero_threshold to hit the objective
zero_threshold = 0.11
one_threshold = 0.99
# Evaluate the model
test_probs = model_unaware.predict_proba(X_test_unaware)[:,1]
preds_approval = (((test_probs>zero_threshold)*1)*[X_test["Group"]==0] + ((test_probs>one_threshold)*1)*[X_test["Group"]==1])[0]
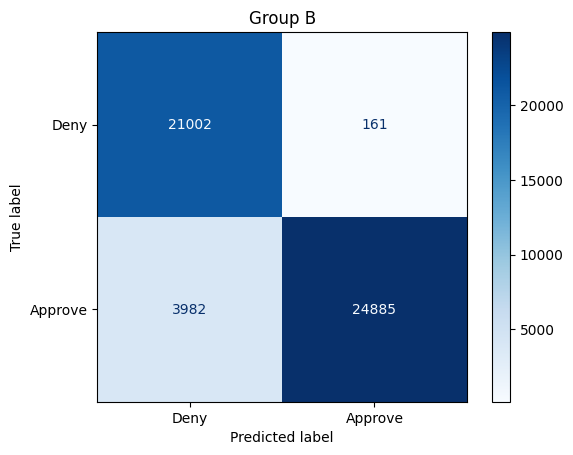
get_stats(X_test, y_test, model_unaware, X_test["Group"]==1, preds_approval)Total approvals: 38241
Group A: 19869 (51.96% of approvals)
Group B: 18372 (48.04% of approvals)
Overall accuracy: 79.38%
Group A: 79.74%
Group B: 79.02%
Sensitivity / True positive rate:
Group A: 100.0%
Group B: 63.64%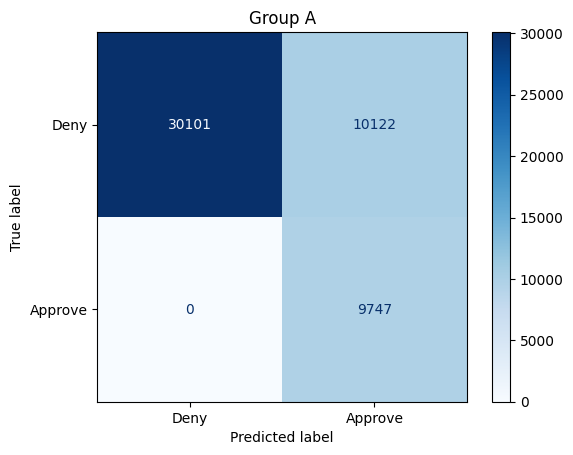
4) Varieties of fairness, part 3
4) 公平的多样性,第 3 部分
How does this final model compare to the previous models, when you consider demographic parity, equal accuracy, and equal opportunity?
当您考虑人口平等、同等准确性和平等机会时,这个最终模型与之前的模型相比如何?
# Check your answer (Run this code cell to get credit!)
q_4.check()
Solution: This model acheives nearly equal representation in the pool of approved applicants from each group -- if demographic parity is what we care about, then this model is much more fair than the first two models. Accuracy is roughly the same for each group, but there is a substantial drop in overall accuracy for each group. If we examine the model for equal opportunity fairness, the model is biased in favor of Group A: all individuals from Group A who should be approved are approved, whereas only 63% of individuals from Group B who should be approved are approved. (This is similar to the dynamic in the first model, with the favored group switched -- that is, in the first model, nearly all individuals from Group B who should be approved were approved by the model.
该模型在每个组中的获批申请人池中实现了几乎相等的代表性——如果我们关心的是人口统计学上的平等,那么该模型比前两个模型公平得多。每个组的准确度大致相同,但每个组的整体准确度都有大幅下降。如果我们检查该模型的平等机会公平性,该模型偏向于 A 组:A 组中所有应获批准的个人都获得了批准,而 B 组中只有 63% 的应获批准的个人获得了批准。(这与第一个模型中的动态类似,只是受青睐的组发生了变化——也就是说,在第一个模型中,B 组中几乎所有应获批准的个人都得到了模型的批准。
This is only a short exercise to explore different types of fairness, and to illustrate the tradeoff that can occur when you optimize for one type of fairness over another. We have focused on model training here, but in practice, to really mitigate bias, or to make ML systems fair, we need to take a close look at every step in the process, from data collection to releasing a final product to users.
这只是一个简短的练习,旨在探索不同类型的公平性,并说明当您优化一种公平性而不是另一种公平性时可能发生的权衡。我们在这里专注于模型训练,但在实践中,为了真正减轻偏见,或者让机器学习系统公平,我们需要仔细研究流程中的每个步骤,从数据收集到向用户发布最终产品。
For instance, if you take a close look at the data, you'll notice that on average, individuals from Group B tend to have higher income than individuals from Group A, and are also more likely to own a home or a car. Knowing this will prove invaluable to deciding what fairness criterion you should use, and to inform ways to achieve fairness. (For instance, it would likely be a bad aproach, if you did not remove the historical bias in the data and then train the model to get equal accuracy for each group.)
例如,如果你仔细查看数据,你会注意到,平均而言,B 组的个人往往比 A 组的个人收入更高,也更有可能拥有房屋或汽车。了解这一点对于决定你应该使用什么公平标准以及告知实现公平的方法将非常有价值。(例如,如果你没有消除数据中的历史偏见,然后训练模型以获得每个组的相同准确度,这可能是一种糟糕的方法。)
In this course, we intentionally avoid taking an opinionated stance on how exactly to minimize bias and ensure fairness in specific projects. This is because the correct answers continue to evolve, since AI fairness is an active area of research. This lesson was a hands-on introduction to the topic, and you can continue your learning by reading blog posts from the Partnership on AI or by following conferences like the ACM Conference on Fairness, Accountability, and Transparency (ACM FAccT).
在本课程中,我们有意避免对如何最大限度地减少偏见并确保特定项目的公平性持主观态度。这是因为正确答案在不断发展,因为 AI 公平性是一个活跃的研究领域。本课程是对该主题的实践介绍,您可以通过阅读 Partnership on AI 的博客文章或关注 ACM 公平性、问责制和透明度会议 (ACM FAccT) 等会议来继续学习。
Keep going
继续前进
Continue to learn how to use model cards to make machine learning models transparent to large audiences.
继续学习如何使用模型卡,让机器学习模型对广大受众透明。