Introduction
简介
One of the most basic questions we might ask of a model is: What features have the biggest impact on predictions?
我们可能会问模型的一个最基本问题是:哪些特征对预测的影响最大?
This concept is called feature importance.
这个概念称为特征重要性。
There are multiple ways to measure feature importance. Some approaches answer subtly different versions of the question above. Other approaches have documented shortcomings.
有多种方法来衡量特征重要性。一些方法回答了上述问题的微妙不同版本。其他方法有记录的缺点。
In this lesson, we'll focus on permutation importance. Compared to most other approaches, permutation importance is:
在本课中,我们将重点介绍排列重要性。与大多数其他方法相比,排列重要性具有以下特点:
- fast to calculate,
- 计算速度快,
- widely used and understood, and
- 广泛使用和理解,以及
- consistent with properties we would want a feature importance measure to have.
- 与我们希望特征重要性度量具有的属性一致。
How It Works
工作原理
Permutation importance uses models differently than anything you've seen so far, and many people find it confusing at first. So we'll start with an example to make it more concrete.
排列重要性使用的模型与您迄今为止看到的任何模型都不同,许多人一开始会觉得它令人困惑。所以我们将从一个例子开始,使其更加具体。
Consider data with the following format:
考虑具有以下格式的数据:
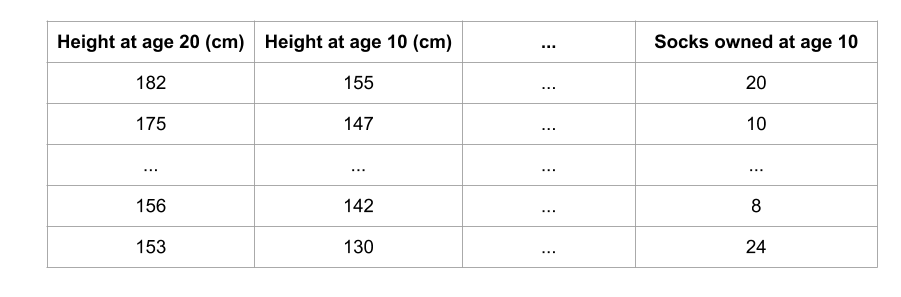
We want to predict a person's height when they become 20 years old, using data that is available at age 10.
我们想使用 10 岁时可用的数据来预测一个人 20 岁时的身高。
Our data includes useful features (height at age 10), features with little predictive power (socks owned), as well as some other features we won't focus on in this explanation.
我们的数据包括有用的特征( 10 岁时的身高 )、预测能力较弱的特征( 拥有的袜子数量 )以及一些我们不会在此解释中重点介绍的其他特征。
Permutation importance is calculated after a model has been fitted. So we won't change the model or change what predictions we'd get for a given value of height, sock-count, etc.
排列重要性是在模型拟合后计算的。因此,我们不会更改模型,也不会更改我们针对给定的身高、袜子数量等值得到的预测。
Instead we will ask the following question: If I randomly shuffle a single column of the validation data, leaving the target and all other columns in place, how would that affect the accuracy of predictions in that now-shuffled data?
相反,我们会问以下问题:如果我随机打乱验证数据的单个列,而保留目标列和所有其他列,这会如何影响现在打乱的数据中的预测准确性?
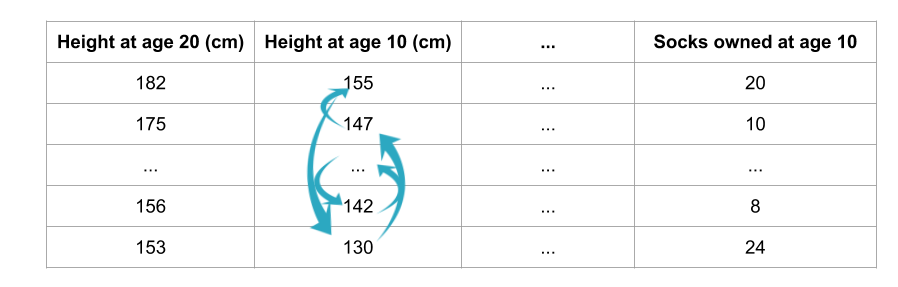
Randomly re-ordering a single column should cause less accurate predictions, since the resulting data no longer corresponds to anything observed in the real world. Model accuracy especially suffers if we shuffle a column that the model relied on heavily for predictions. In this case, shuffling height at age 10 would cause terrible predictions. If we shuffled socks owned instead, the resulting predictions wouldn't suffer nearly as much.
随机重新排序单个列会导致预测不太准确,因为结果数据不再与现实世界中观察到的任何事物相对应。如果我们对模型在预测中高度依赖的列进行打乱,模型准确性会受到特别大的影响。在这种情况下,打乱10 岁时的身高会导致糟糕的预测。如果我们改为打乱拥有的袜子,结果预测就不会受到太大的影响。
With this insight, the process is as follows:
根据这一见解,该过程如下:
- Get a trained model.
- 获得经过训练的模型。
- Shuffle the values in a single column, make predictions using the resulting dataset. Use these predictions and the true target values to calculate how much the loss function suffered from shuffling. That performance deterioration measures the importance of the variable you just shuffled.
- 将单个列中的值打乱,使用结果数据集进行预测。使用这些预测和真实目标值来计算损失函数因打乱而遭受的损失。性能下降衡量了您刚刚打乱的变量的重要性。
- Return the data to the original order (undoing the shuffle from step 2). Now repeat step 2 with the next column in the dataset, until you have calculated the importance of each column.
- 将数据恢复到原始顺序(撤消步骤 2 中的打乱)。现在对数据集中的下一列重复步骤 2,直到您计算出每列的重要性。
Code Example
代码示例
Our example will use a model that predicts whether a soccer/football team will have the "Man of the Game" winner based on the team's statistics. The "Man of the Game" award is given to the best player in the game. Model-building isn't our current focus, so the cell below loads the data and builds a rudimentary model.
我们的示例将使用一个模型,该模型根据球队的统计数据预测足球队是否会有“最佳球员”获胜者。“最佳球员”奖授予比赛中最好的球员。模型构建不是我们当前的重点,因此下面的单元格加载数据并构建一个基本模型。
import numpy as np
import pandas as pd
from sklearn.model_selection import train_test_split
from sklearn.ensemble import RandomForestClassifier

data = pd.read_csv('../input/fifa-2018-match-statistics/FIFA 2018 Statistics.csv')
y = (data['Man of the Match'] == "Yes")  # Convert from string "Yes"/"No" to binary
feature_names = [i for i in data.columns if data[i].dtype in [np.int64]]
X = data[feature_names]
train_X, val_X, train_y, val_y = train_test_split(X, y, random_state=1)
my_model = RandomForestClassifier(n_estimators=100,
                                  random_state=0).fit(train_X, train_y)
Here is how to calculate and show importances with the eli5 library:
下面说明了如何使用 eli5 库来计算和显示重要性:
import eli5
from eli5.sklearn import PermutationImportance

perm = PermutationImportance(my_model, random_state=1).fit(val_X, val_y)
eli5.show_weights(perm, feature_names = val_X.columns.tolist())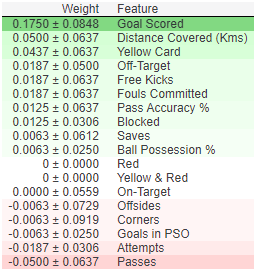
Interpreting Permutation Importances
解释排列重要性
The values towards the top are the most important features, and those towards the bottom matter least.
顶部的值是最重要的特征,底部的值最不重要。
The first number in each row shows how much model performance decreased with a random shuffling (in this case, using "accuracy" as the performance metric).
每行中的第一个数字显示随机改组后模型性能下降了多少(在本例中,使用“准确度”作为性能指标)。
Like most things in data science, there is some randomness to the exact performance change from a shuffling a column. We measure the amount of randomness in our permutation importance calculation by repeating the process with multiple shuffles. The number after the ± measures how performance varied from one-reshuffling to the next.
与数据科学中的大多数事物一样,改组一列后的性能变化具有一定的随机性。我们通过多次改组重复该过程来测量排列重要性计算中的随机性。 ± 后面的数字测量从一次改组到下一次改组的性能变化。
You'll occasionally see negative values for permutation importances. In those cases, the predictions on the shuffled (or noisy) data happened to be more accurate than the real data. This happens when the feature didn't matter (should have had an importance close to 0), but random chance caused the predictions on shuffled data to be more accurate. This is more common with small datasets, like the one in this example, because there is more room for luck/chance.
您偶尔会看到排列重要性的负值。在这些情况下,对改组(或嘈杂)数据的预测恰好比真实数据更准确。当特征不重要(应该具有接近 0 的重要性)但随机机会导致对改组数据的预测更准确时,就会发生这种情况。这在小型数据集(如本例中的数据集)中更为常见,因为运气/机会的空间更大。
In our example, the most important feature was Goals scored. That seems sensible. Soccer fans may have some intuition about whether the orderings of other variables are surprising or not.
在我们的例子中,最重要的特征是 进球数。这似乎是合理的。足球迷可能对其他变量重要性的排序是否令人惊讶有一些直觉。
Your Turn
轮到你了
Get started here to flex your new permutation importance knowledge.
从这里开始 来展示你新的排列重要性知识。