This notebook is an exercise in the Machine Learning Explainability course. You can reference the tutorial at this link.
Set Up
设置
At this point, you have enough tools to put together compelling solutions to real-world problems. You will ned to pick the right techniques for each part of the following data science scenario. Along the way, you'll use SHAP values along with your other insights tools.
此时,您有足够的工具来整合现实世界问题的令人信服的解决方案。您需要为以下数据科学场景的每个部分选择正确的技术。在此过程中,您将使用 SHAP 值以及其他洞察工具。
The questions below give you feedback on your work by using some checking code. Run the following cell to set up our feedback system.
以下问题通过使用一些检查代码为您提供有关您工作的反馈。运行以下单元格以设置我们的反馈系统。
# Get most recent checking code
!pip install -U -t /kaggle/working/ git+https://github.com/Kaggle/learntools.git
from learntools.ml_explainability.ex4 import *
print("Setup Complete")
Collecting git+https://github.com/Kaggle/learntools.git
Cloning https://github.com/Kaggle/learntools.git to /tmp/pip-req-build-ey9siwe0
Running command git clone --filter=blob:none --quiet https://github.com/Kaggle/learntools.git /tmp/pip-req-build-ey9siwe0
Resolved https://github.com/Kaggle/learntools.git to commit ca2a51ee0085e4943cadaf5e9fe7dce2ec947d3c
Preparing metadata (setup.py) ... [?25ldone
[?25hBuilding wheels for collected packages: learntools
Building wheel for learntools (setup.py) ... [?25ldone
[?25h Created wheel for learntools: filename=learntools-0.3.4-py3-none-any.whl size=268968 sha256=97dd44942480a7f88c95ff8dd7f6c350ddaabd763eba9529c0bd24d5d386b45a
Stored in directory: /tmp/pip-ephem-wheel-cache-5x18apvm/wheels/2f/6c/3c/aa9f50cfb5a862157cb4c7a5b34881828cf45404698255dced
Successfully built learntools
Installing collected packages: learntools
Successfully installed learntools-0.3.4
Setup CompleteThe Scenario
场景
A hospital has struggled with "readmissions," where they release a patient before the patient has recovered enough, and the patient returns with health complications.
一家医院一直在努力解决“再入院”问题,即在患者恢复得足够好之前就让其出院,而患者再次入院时又出现了健康问题。
The hospital wants your help identifying patients at highest risk of being readmitted. Doctors (rather than your model) will make the final decision about when to release each patient; but they hope your model will highlight issues the doctors should consider when releasing a patient.
医院希望您能帮助确定再入院风险最高的患者。医生(而不是您的模型)将最终决定何时让每位患者出院;但他们希望您的模型能够突出医生在让患者出院时应考虑的问题。
The hospital has given you relevant patient medical information. Here is a list of columns in the data:
医院已向您提供了相关的患者医疗信息。以下是数据中的特征列表:
import pandas as pd
data = pd.read_csv('../input/hospital-readmissions/train.csv')
data.columns
Index(['time_in_hospital', 'num_lab_procedures', 'num_procedures',
'num_medications', 'number_outpatient', 'number_emergency',
'number_inpatient', 'number_diagnoses', 'race_Caucasian',
'race_AfricanAmerican', 'gender_Female', 'age_[70-80)', 'age_[60-70)',
'age_[50-60)', 'age_[80-90)', 'age_[40-50)', 'payer_code_?',
'payer_code_MC', 'payer_code_HM', 'payer_code_SP', 'payer_code_BC',
'medical_specialty_?', 'medical_specialty_InternalMedicine',
'medical_specialty_Emergency/Trauma',
'medical_specialty_Family/GeneralPractice',
'medical_specialty_Cardiology', 'diag_1_428', 'diag_1_414',
'diag_1_786', 'diag_2_276', 'diag_2_428', 'diag_2_250', 'diag_2_427',
'diag_3_250', 'diag_3_401', 'diag_3_276', 'diag_3_428',
'max_glu_serum_None', 'A1Cresult_None', 'metformin_No',
'repaglinide_No', 'nateglinide_No', 'chlorpropamide_No',
'glimepiride_No', 'acetohexamide_No', 'glipizide_No', 'glyburide_No',
'tolbutamide_No', 'pioglitazone_No', 'rosiglitazone_No', 'acarbose_No',
'miglitol_No', 'troglitazone_No', 'tolazamide_No', 'examide_No',
'citoglipton_No', 'insulin_No', 'glyburide-metformin_No',
'glipizide-metformin_No', 'glimepiride-pioglitazone_No',
'metformin-rosiglitazone_No', 'metformin-pioglitazone_No', 'change_No',
'diabetesMed_Yes', 'readmitted'],
dtype='object')Here are some quick hints at interpreting the field names:
以下是一些解释字段名称的快速提示:
- Your prediction target is
readmitted - 您的预测目标是
重新入院 - Columns with the word
diagindicate the diagnostic code of the illness or illnesses the patient was admitted with. For example,diag_1_428means the doctor said their first illness diagnosis is number "428". What illness does 428 correspond to? You could look it up in a codebook, but without more medical background it wouldn't mean anything to you anyway. - 带有单词
diag的列表示患者入院时所患疾病的诊断代码。例如,diag_1_428表示医生说他们的第一个疾病诊断是428。428 对应的是什么疾病?您可以在代码本中查找,但如果没有更多的医学背景,它对您来说没有任何意义。 - A column names like
glimepiride_Nomean the patient did not have the medicineglimepiride. If this feature had a value of False, then the patient did take the drugglimepiride - 像
glimepiride_No这样的列名表示患者没有服用药物glimepiride。如果此特征的值为 False,则患者确实服用了药物glimepiride - Features whose names begin with
medical_specialtydescribe the specialty of the doctor seeing the patient. The values in these fields are allTrueorFalse. - 名称以
medical_specialty开头的特征描述了看病医生的专业。这些字段中的值都是True或False。
Your Code Library
您的代码库
As you write code to work through this scenario, these code snippets from previous tutorials may be useful. You'll still need to modify them, but we've copied them here to save you from having to look them up.
当您编写代码来完成此场景时,以前教程中的这些代码片段可能会有用。您仍然需要修改它们,但我们已将它们复制到此处,以免您查找它们。
Calculate and show permutation importance:
计算并显示排列重要性:
import eli5
from eli5.sklearn import PermutationImportance

perm = PermutationImportance(my_model, random_state=1).fit(val_X, val_y)
eli5.show_weights(perm, feature_names = val_X.columns.tolist())
Calculate and show partial dependence plot:
计算并显示部分依赖图:
from matplotlib import pyplot as plt
from sklearn.inspection import PartialDependenceDisplay

feature_name = 'Goal Scored'
PartialDependenceDisplay.from_estimator(my_model, val_X, [feature_name])
plt.show()
Calculate and show Shap Values for One Prediction:
计算并显示一个预测的SHAP值:
import shap  # package used to calculate Shap values

data_for_prediction = val_X.iloc[0,:]  # use 1 row of data here. Could use multiple rows if desired

# Create object that can calculate shap values
explainer = shap.TreeExplainer(my_model)
shap_values = explainer.shap_values(data_for_prediction)
shap.initjs()
shap.force_plot(explainer.expected_value[0], shap_values[0], data_for_prediction)
Step 1
步骤 1
You have built a simple model, but the doctors say they don't know how to evaluate a model, and they'd like you to show them some evidence the model is doing something in line with their medical intuition. Create any graphics or tables that will show them a quick overview of what the model is doing?
您已经构建了一个简单的模型,但医生说他们不知道如何评估模型,他们希望您向他们展示一些证据,证明该模型正在做一些符合他们医学直觉的事情。创建任何图形或表格,向他们展示模型正在做什么的快速概览?
They are very busy. So they want you to condense your model overview into just 1 or 2 graphics, rather than a long string of graphics.
他们很忙。所以他们希望您将模型概述压缩为 1 或 2 个图形,而不是一长串图形。
We'll start after the point where you've built a basic model. Just run the following cell to build the model called my_model.
我们将从您构建基本模型的点开始。只需运行以下单元格即可构建名为my_model的模型。
import pandas as pd
from sklearn.ensemble import RandomForestClassifier
from sklearn.model_selection import train_test_split

data = pd.read_csv('../input/hospital-readmissions/train.csv')

y = data.readmitted

base_features = [c for c in data.columns if c != "readmitted"]

X = data[base_features]

train_X, val_X, train_y, val_y = train_test_split(X, y, random_state=1)
my_model = RandomForestClassifier(n_estimators=30, random_state=1).fit(train_X, train_y)
Now use the following cell to create the materials for the doctors.
现在使用以下单元格为医生创建材料。
# Your code here
# ____

import eli5
from eli5.sklearn import PermutationImportance

perm = PermutationImportance(my_model, random_state=1).fit(val_X, val_y)
eli5.show_weights(perm, feature_names = val_X.columns.tolist())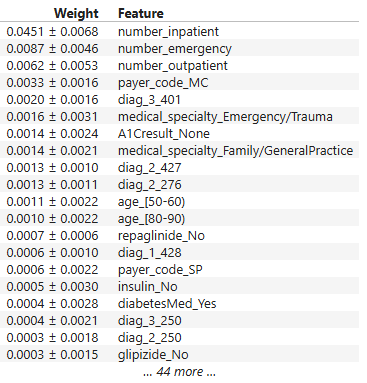
For our idea of what to show, run the cell below.
为了了解我们要展示什么,请运行下面的单元格。
# Run this code cell to receive credit!
q_1.solution()
Solution:
# Use permutation importance as a succinct model summary
# A measure of model performance on validation data would be useful here too

import eli5
from eli5.sklearn import PermutationImportance

perm = PermutationImportance(my_model, random_state=1).fit(val_X, val_y)
eli5.show_weights(perm, feature_names = val_X.columns.tolist())
If you'd like to discuss your approach or see what others have done, we have a discussion forum here.
如果你想讨论你的方法或者看看其他人做了什么,我们有一个讨论论坛 这里。
Step 2
第 2 步
It appears number_inpatient is a really important feature. The doctors would like to know more about that. Create a graph for them that shows how num_inpatient affects the model's predictions.
看来number_inpatient是一个非常重要的特征。医生们想了解更多相关信息。为他们创建一个图表,显示num_inpatient如何影响模型的预测。
# Your Code Here
# ____
from matplotlib import pyplot as plt
from sklearn.inspection import PartialDependenceDisplay

feature_name = 'number_inpatient'
PartialDependenceDisplay.from_estimator(my_model, val_X, [feature_name])
plt.show()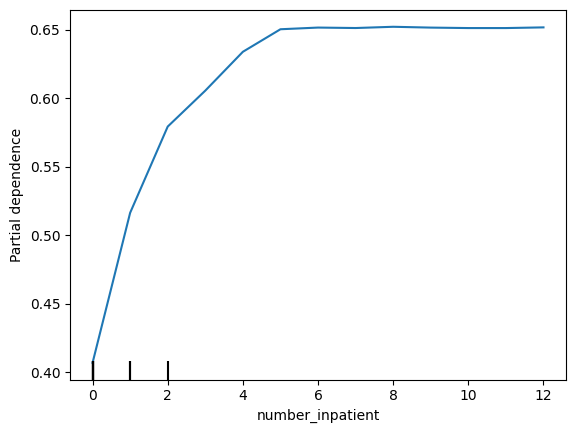
For our solution, run the line below.
对于我们的解决方案,请运行下面的行。
# Check your answer (Run this code cell to receive credit!)
q_2.solution()
Solution:
# PDP for number_inpatient feature

from matplotlib import pyplot as plt
from sklearn.inspection import PartialDependenceDisplay

feature_name = 'number_inpatient'
PartialDependenceDisplay.from_estimator(my_model, val_X, [feature_name])
plt.show()
Step 3
步骤 3
The doctors think it's a good sign that increasing the number of inpatient procedures leads to increased predictions. But they can't tell from this plot whether that change in the plot is big or small. They'd like you to create something similar for time_in_hospital to see how that compares.
医生认为增加住院手术数量会导致预测增加,这是一个好兆头。但他们无法从这个图中看出图中的变化是大还是小。他们希望您为time_in_hospital创建类似的内容,以查看比较结果。
# Your Code Here
# ____
feature_name = 'time_in_hospital'
PartialDependenceDisplay.from_estimator(my_model, val_X, [feature_name])
plt.show()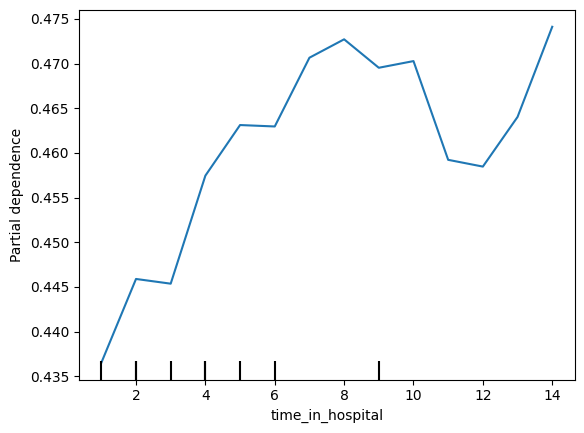
Uncomment the relevant line below to see one solution.
取消注释下面相关的行来查看一个解决方案。
# Check your answer (Run this code cell to receive credit!)
q_3.solution()
Solution:
The results are very different. Specifically time in hospital has a much smaller effect. Code below:
from matplotlib import pyplot as plt
from sklearn.inspection import PartialDependenceDisplay

feature_name = 'time_in_hospital'
PartialDependenceDisplay.from_estimator(my_model, val_X, [feature_name])
plt.show()
Step 4
步骤 4
Woah! It seems like time_in_hospital doesn't matter at all. The difference between the lowest value on the partial dependence plot and the highest value is about 5%.
哇!似乎住院时间根本不重要。部分依赖图上的最低值与最高值之间的差异约为 5%。
If that is what your model concluded, the doctors will believe it. But it seems so low. Could the data be wrong, or is your model doing something more complex than they expect?
如果这是您的模型得出的结论,医生会相信的。但它似乎太低了。数据可能是错误的,还是您的模型正在做一些比他们预期更复杂的事情?
They'd like you to show them the raw readmission rate for each value of time_in_hospital to see how it compares to the partial dependence plot.
他们希望您向他们展示住院时间每个值的原始再入院率,看看它与部分依赖图相比如何。
- Make that plot.
- 制作该图。
- Are the results similar or different?
- 结果相似还是不同?
# Your Code Here
# ____
pd.concat([train_X, train_y], axis=1).groupby(['time_in_hospital'])['readmitted'].mean().plot()
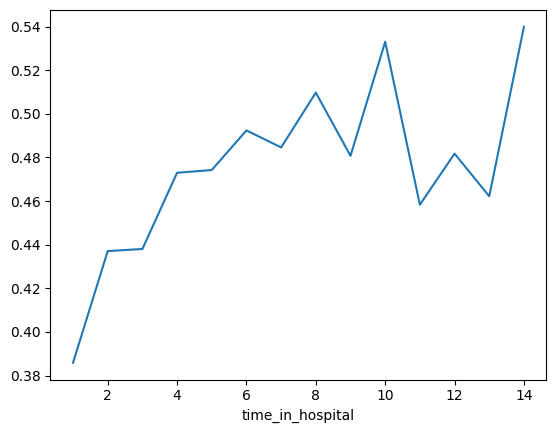
data.groupby(['time_in_hospital'])['readmitted'].mean().plot()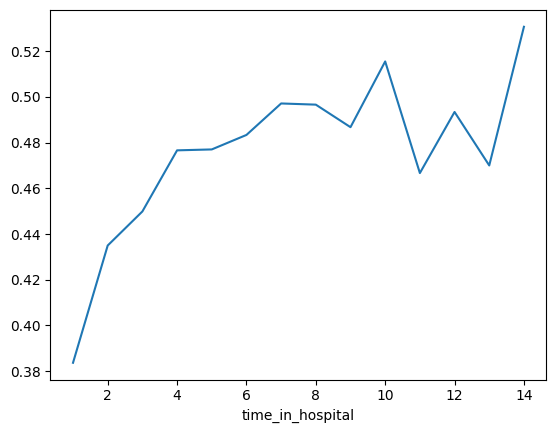
For a hint, uncomment the line below.
作为提示,请取消注释下面这一行。
# q_4.hint()# Check your answer (Run this code cell to receive credit!)
q_4.solution()Solution:
# A simple pandas groupby showing the average readmission rate for each time_in_hospital.

# Do concat to keep validation data separate, rather than using all original data
all_train = pd.concat([train_X, train_y], axis=1)

all_train.groupby(['time_in_hospital']).mean().readmitted.plot()
plt.show()
Step 5
第 5 步
Now the doctors are convinced you have the right data, and the model overview looked reasonable. It's time to turn this into a finished product they can use. Specifically, the hospital wants you to create a function patient_risk_factors that does the following
现在医生们确信您拥有正确的数据,并且模型概述看起来很合理。是时候将其变成他们可以使用的成品了。具体来说,医院希望您创建一个函数patient_risk_factors,该函数执行以下操作
- Takes a single row with patient data (of the same format you as your raw data)
- 获取包含患者数据的单行(与原始数据格式相同)
- Creates a visualization showing what features of that patient increased their risk of readmission, what features decreased it, and how much those features mattered.
- 创建一个可视化,显示该患者的哪些特征增加了再入院风险,哪些特征降低了再入院风险,以及这些特征有多重要。
It's not important to show every feature with every miniscule impact on the readmission risk. It's fine to focus on only the most important features for that patient.
没有必要显示每个特征对再入院风险的每一个微小影响。只需关注该患者最重要的特征即可。
# Your Code Here
# ____
import shap  # package used to calculate Shap values

data_for_prediction = val_X.iloc[0,:]  # use 1 row of data here. Could use multiple rows if desired

# Create object that can calculate shap values
explainer = shap.TreeExplainer(my_model)
shap_values = explainer.shap_values(data_for_prediction)
shap.initjs()
shap.force_plot(explainer.expected_value[0], shap_values[0], data_for_prediction)
import shap  # package used to calculate Shap values

sample_data_for_prediction = val_X.iloc[0].astype(float)  # to test function

def patient_risk_factors(model, patient_data):
    # Create object that can calculate shap values
    explainer = shap.TreeExplainer(model)
    shap_values = explainer.shap_values(patient_data)
    shap.initjs()
    return shap.force_plot(explainer.expected_value[1], shap_values[1], patient_data)

patient_risk_factors(my_model, sample_data_for_prediction)
For a hint, uncomment the line below.
作为提示,请取消注释下面这一行。
q_5.hint()Hint: Here's the time to use SHAP values
提示:这是使用 SHAP 值的时候
# Check your answer (Run this code cell to receive credit!)
q_5.solution()
Solution:
# Use SHAP values to show the effect of each feature of a given patient

import shap  # package used to calculate Shap values

sample_data_for_prediction = val_X.iloc[0].astype(float)  # to test function

def patient_risk_factors(model, patient_data):
    # Create object that can calculate shap values
    explainer = shap.TreeExplainer(model)
    shap_values = explainer.shap_values(patient_data)
    shap.initjs()
    return shap.force_plot(explainer.expected_value[1], shap_values[1], patient_data)
Keep Going
继续
You have some powerful tools to get insights about both models and individual predictions. Next you will look at aggregations of SHAP values to link the model-level and prediction-level insights.
您拥有一些强大的工具来获取有关模型和单个预测的见解。接下来,您将查看 SHAP 值的聚合,以将模型级和预测级见解联系起来。