This notebook is an exercise in the Data Visualization course. You can reference the tutorial at this link.
In this exercise, you'll explore different chart styles, to see which color combinations and fonts you like best!
在本练习中,您将探索不同的图表样式,看看您最喜欢哪种颜色组合和字体!
Setup
设置
Run the next cell to import and configure the Python libraries that you need to complete the exercise.
运行下一个单元以导入和配置完成练习所需的 Python 库。
import pandas as pd
pd.plotting.register_matplotlib_converters()
import matplotlib.pyplot as plt
%matplotlib inline
import seaborn as sns
print("Setup Complete")
Setup CompleteThe questions below will give you feedback on your work. Run the following cell to set up our feedback system.
以下问题将为您提供有关您工作的反馈。 运行以下单元格来设置我们的反馈系统。
# Set up code checking
import os
if not os.path.exists("../input/spotify.csv"):
    os.symlink("../input/data-for-datavis/spotify.csv", "../input/spotify.csv")
from learntools.core import binder
binder.bind(globals())
from learntools.data_viz_to_coder.ex6 import *
print("Setup Complete")
Setup CompleteYou'll work with a chart from the previous tutorial. Run the next cell to load the data.
您将使用上一教程中的图表。 运行下一个单元格以加载数据。
# Path of the file to read
spotify_filepath = "../input/spotify.csv"

# Read the file into a variable spotify_data
spotify_data = pd.read_csv(spotify_filepath, index_col="Date", parse_dates=True)
Try out seaborn styles
尝试seaborn风格
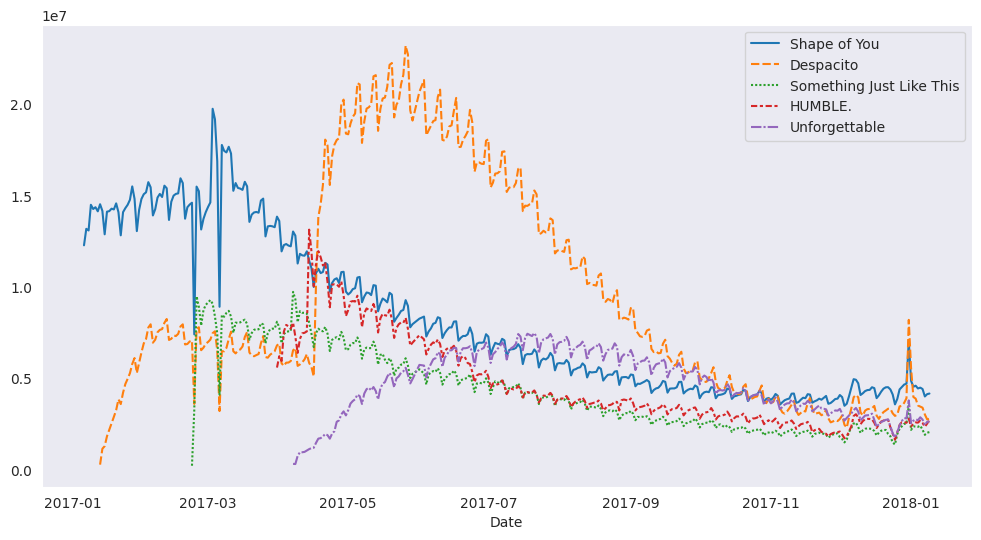
Run the command below to try out the "dark" theme.
运行以下命令来尝试"dark"主题。
# Change the style of the figure
sns.set_style("dark")

# Line chart
plt.figure(figsize=(12,6))
sns.lineplot(data=spotify_data)

# Mark the exercise complete after the code cell is run
step_1.check()
/opt/conda/lib/python3.10/site-packages/seaborn/_oldcore.py:1119: FutureWarning: use_inf_as_na option is deprecated and will be removed in a future version. Convert inf values to NaN before operating instead.
with pd.option_context('mode.use_inf_as_na', True):
/opt/conda/lib/python3.10/site-packages/seaborn/_oldcore.py:1119: FutureWarning: use_inf_as_na option is deprecated and will be removed in a future version. Convert inf values to NaN before operating instead.
with pd.option_context('mode.use_inf_as_na', True):Correct:
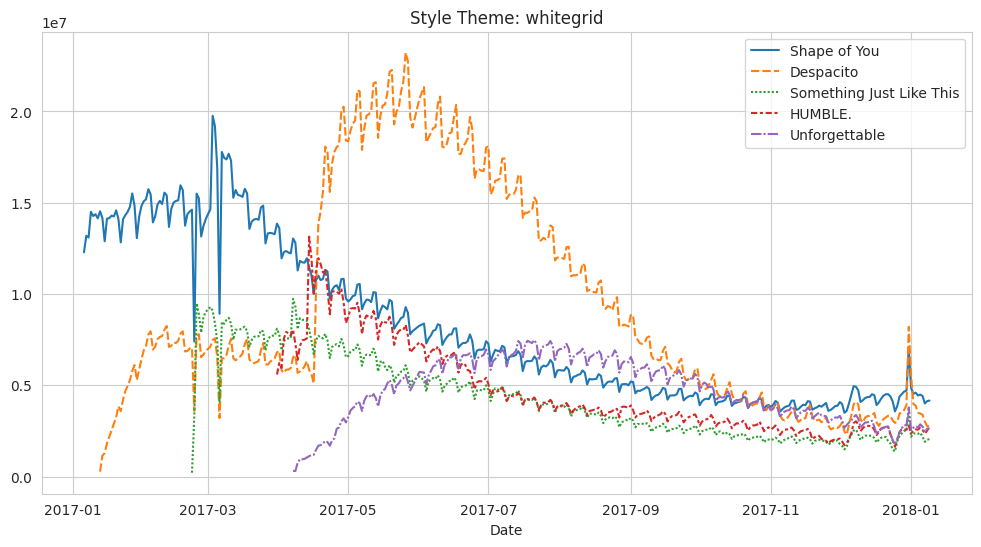
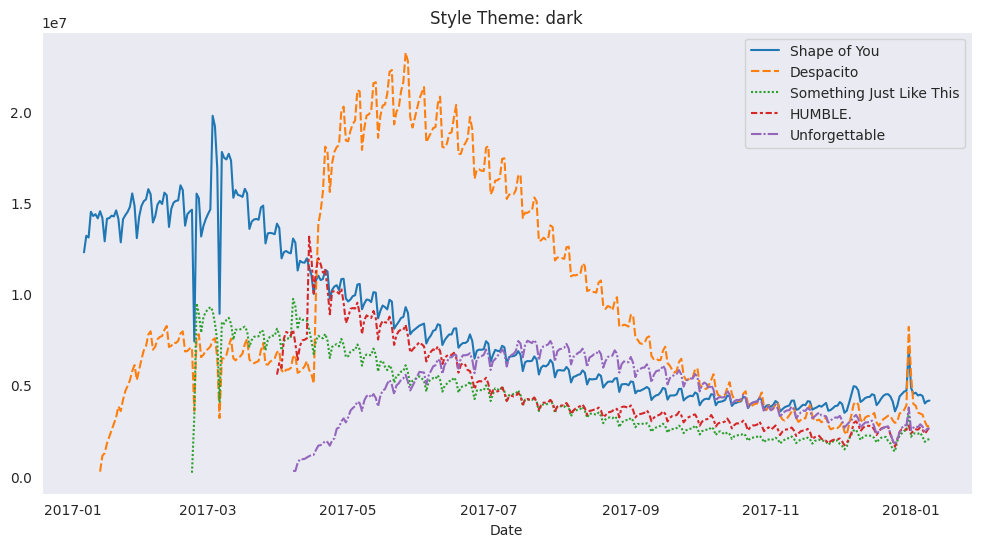
for style in ['darkgrid', 'whitegrid', 'dark', 'white', 'ticks']:
    sns.set_style(style)
    plt.figure(figsize=(12,6))
    plt.title(f"Style Theme: {style}")
    sns.lineplot(data=spotify_data)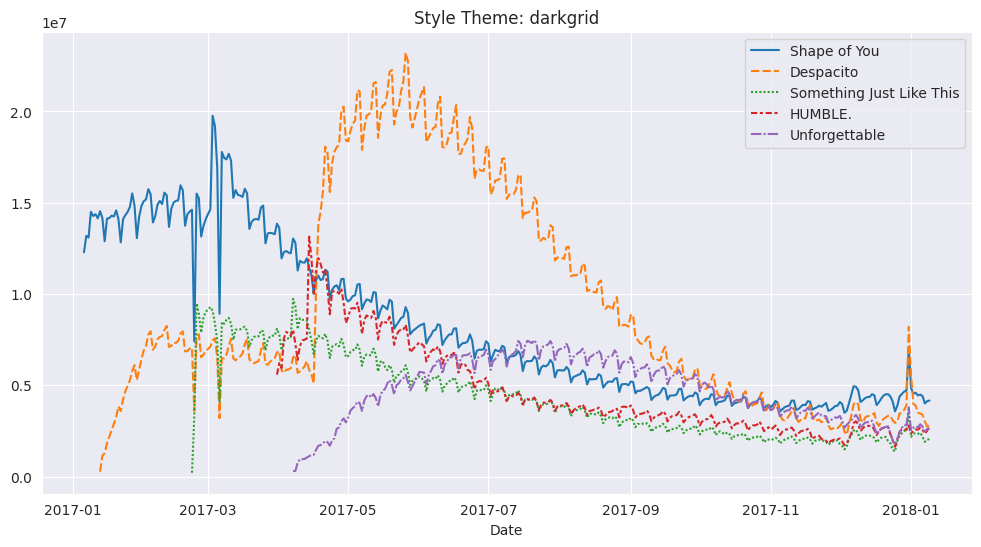
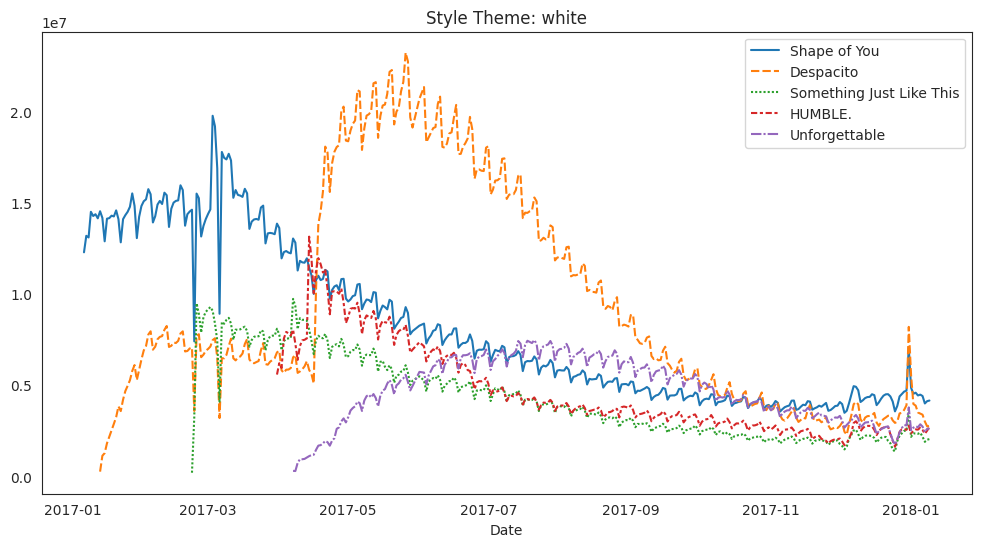
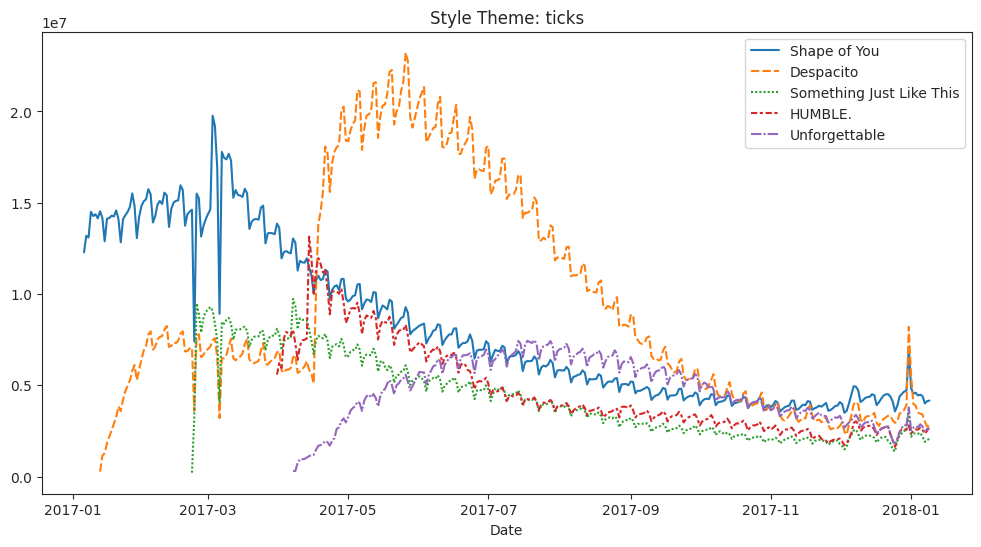
Now, try out different themes by amending the first line of code and running the code cell again. Remember the list of available themes
现在,通过修改第一行代码并再次运行代码单元来尝试不同的主题。 记住可用主题的列表:
"darkgrid""whitegrid""dark""white""ticks"
This notebook is your playground -- feel free to experiment as little or as much you wish here! The exercise is marked as complete after you run every code cell in the notebook at least once.
这款笔记本就是您的游乐场——您可以随意在这里进行尽可能少或尽可能多的实验! 在您运行笔记本中的每个代码单元至少一次后,练习将被标记为完成。
Keep going
继续前进
Learn about how to select and visualize your own datasets in the next tutorial!
在下一个教程中了解如何选择和可视化您自己的数据集!