This notebook is an exercise in the Data Cleaning course. You can reference the tutorial at this link.
In this exercise, you'll apply what you learned in the Scaling and normalization tutorial.
在本练习中,您将应用在缩放和规范化教程中学到的知识。
Setup
设置
The questions below will give you feedback on your work. Run the following cell to set up the feedback system.
以下问题将为您提供有关您工作的反馈。 运行以下单元格来设置反馈系统。
from learntools.core import binder
binder.bind(globals())
from learntools.data_cleaning.ex2 import *
print("Setup Complete")
Setup CompleteGet our environment set up
设置我们的环境
To practice scaling and normalization, we're going to use a dataset of Kickstarter campaigns. (Kickstarter is a website where people can ask people to invest in various projects and concept products.)
为了练习缩放和标准化,我们将使用 Kickstarter 活动数据集。 (Kickstarter 是一个网站,人们可以在这里请求人们投资各种项目和概念产品。)
The next code cell loads in the libraries and dataset we'll be using.
下一个代码单元将加载我们将使用的库和数据集。
# modules we'll use
import pandas as pd
import numpy as np

# for Box-Cox Transformation
from scipy import stats

# for min_max scaling
from mlxtend.preprocessing import minmax_scaling

# plotting modules
import seaborn as sns
import matplotlib.pyplot as plt

# read in all our data
kickstarters_2017 = pd.read_csv("../input/kickstarter-projects/ks-projects-201801.csv")

# set seed for reproducibility
np.random.seed(0)
Let's start by scaling the goals of each campaign, which is how much money they were asking for. After scaling, all values lie between 0 and 1.
让我们首先确定每个活动的目标,即他们要多少钱。 缩放后,所有值都位于 0 和 1 之间。
# select the usd_goal_real column
original_data = pd.DataFrame(kickstarters_2017.usd_goal_real)

# scale the goals from 0 to 1
scaled_data = minmax_scaling(original_data, columns=['usd_goal_real'])

print('Original data\nPreview:\n', original_data.head())
print('Minimum value:', float(original_data.iloc[:,0].min()),
      '\nMaximum value:', float(original_data.iloc[:,0].max()))
print('_'*30)

print('\nScaled data\nPreview:\n', scaled_data.head())
print('Minimum value:', float(scaled_data.iloc[:,0].min()),
      '\nMaximum value:', float(scaled_data.iloc[:,0].max()))
Original data
Preview:
usd_goal_real
0 1533.95
1 30000.00
2 45000.00
3 5000.00
4 19500.00
Minimum value: 0.01
Maximum value: 166361390.71
______________________________
Scaled data
Preview:
usd_goal_real
0 0.000009
1 0.000180
2 0.000270
3 0.000030
4 0.000117
Minimum value: 0.0
Maximum value: 1.01) Practice scaling
1) 练习缩放
We just scaled the "usd_goal_real" column. What about the "goal" column?
我们刚刚缩放了usd_goal_real列。 缩放目标列会怎么样?
Begin by running the code cell below to create a DataFrame original_goal_data containing the "goal" column.
首先运行下面的代码单元格来创建一个包含goal列的 DataFrame original_goal_data。
# select the usd_goal_real column
original_goal_data = pd.DataFrame(kickstarters_2017.goal)
Use original_goal_data to create a new DataFrame scaled_goal_data with values scaled between 0 and 1. You must use the minmax_scaling() function.
使用original_goal_data创建一个新的 DataFramescaled_goal_data,其值在 0 到 1 之间缩放。您必须使用minmax_scaling()函数。
# TODO: Your code here
# scaled_goal_data = ____
scaled_goal_data = minmax_scaling(original_goal_data, columns=['goal'])

# Check your answer
q1.check()
Correct
# Lines below will give you a hint or solution code
#q1.hint()
q1.solution()
Solution:
scaled_goal_data = minmax_scaling(original_goal_data, columns=['goal'])
2) Practice normalization
2) 练习标准化
Now you'll practice normalization. We begin by normalizing the amount of money pledged to each campaign.
现在您将练习标准化。 我们首先将每项活动的承诺资金数额标准化。
# get the index of all positive pledges (Box-Cox only takes positive values)
index_of_positive_pledges = kickstarters_2017.usd_pledged_real > 0

# get only positive pledges (using their indexes)
positive_pledges = kickstarters_2017.usd_pledged_real.loc[index_of_positive_pledges]

# normalize the pledges (w/ Box-Cox)
normalized_pledges = pd.Series(stats.boxcox(positive_pledges)[0],
                               name='usd_pledged_real', index=positive_pledges.index)

print('Original data\nPreview:\n', positive_pledges.head())
print('Minimum value:', float(positive_pledges.min()),
      '\nMaximum value:', float(positive_pledges.max()))
print('_'*30)

print('\nNormalized data\nPreview:\n', normalized_pledges.head())
print('Minimum value:', float(normalized_pledges.min()),
      '\nMaximum value:', float(normalized_pledges.max()))
Original data
Preview:
1 2421.0
2 220.0
3 1.0
4 1283.0
5 52375.0
Name: usd_pledged_real, dtype: float64
Minimum value: 0.45
Maximum value: 20338986.27
______________________________
Normalized data
Preview:
1 10.165142
2 6.468598
3 0.000000
4 9.129277
5 15.836853
Name: usd_pledged_real, dtype: float64
Minimum value: -0.7779954122762203
Maximum value: 30.69054020451361The values have changed significantly with normalization!
随着标准化,这些值发生了显着变化!
In the next code cell, you'll take a look at the distribution of the normalized data, where it should now resemble a normal distribution.
在下一个代码单元中,您将查看标准化数据的分布,它现在应该类似于正态分布。
# 原有数据的分布过于集中,作图时会出现问题。
# sns.histplot(positive_pledges, kde=True)
# plot normalized data
ax = sns.histplot(normalized_pledges, kde=True)
ax.set_title("Normalized data")
plt.show()
/opt/conda/lib/python3.10/site-packages/seaborn/_oldcore.py:1119: FutureWarning: use_inf_as_na option is deprecated and will be removed in a future version. Convert inf values to NaN before operating instead.
with pd.option_context('mode.use_inf_as_na', True):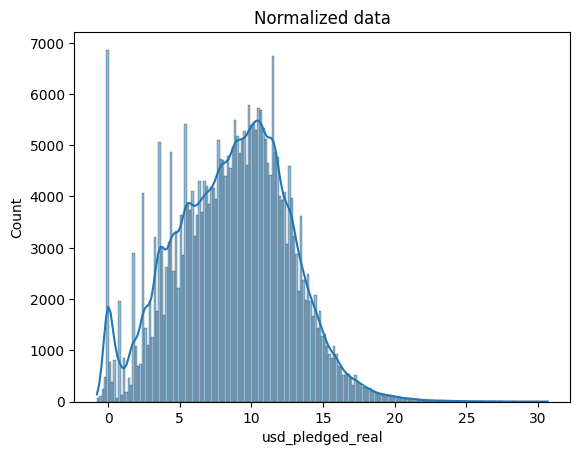
We used the "usd_pledged_real" column. Follow the same process to normalize the "pledged" column.
我们使用usd_pledged_real列。 按照相同的流程标准化pledged列。
# TODO: Your code here!
# get the index of all positive pledges (Box-Cox only takes positive values)
index_of_positive_pledged = kickstarters_2017.pledged > 0

# get only positive pledges (using their indexes)
positive_pledged = kickstarters_2017.pledged.loc[index_of_positive_pledged]

# normalize the pledges (w/ Box-Cox)
normalized_pledged = pd.Series(stats.boxcox(positive_pledged)[0],
                               name='pledged', index=positive_pledged.index)

sns.histplot(normalized_pledged, kde=True)
/opt/conda/lib/python3.10/site-packages/seaborn/_oldcore.py:1119: FutureWarning: use_inf_as_na option is deprecated and will be removed in a future version. Convert inf values to NaN before operating instead.
with pd.option_context('mode.use_inf_as_na', True):
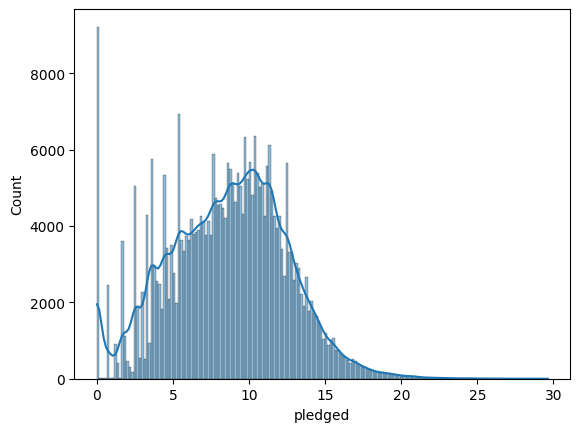
How does the normalized "usd_pledged_real" column look different from when we normalized the "pledged" column? Or, do they look mostly the same?
标准化的usd_pledged_real列与我们标准化的pledged列有何不同? 或者,它们看起来大部分相同吗?
Once you have an answer, run the code cell below.
获得答案后,运行下面的代码单元格。
# Check your answer (Run this code cell to receive credit!)
q2.check()
Correct:
The distributions in the normalized data look mostly the same.
# Line below will give you a hint
q2.hint()
Hint:
Try running this code:
# get the index of all positive pledges (Box-Cox only takes positive values)
index_positive_pledges = kickstarters_2017.pledged > 0

# get only positive pledges (using their indexes)
positive_pledges_only = kickstarters_2017.pledged.loc[index_positive_pledges]

# normalize the pledges (w/ Box-Cox)
normalized_values = pd.Series(stats.boxcox(positive_pledges_only)[0],
                              name='pledged', index=positive_pledges_only.index)

# plot normalized data
ax = sns.histplot(normalized_values, kde=True)
ax.set_title("Normalized data")
(Optional) More practice
(可选)更多练习
Try finding a new dataset and pretend you're preparing to perform a regression analysis.
尝试找到一个新的数据集,并假装您正准备执行回归分析。
These datasets are a good start!
Pick three or four variables and decide if you need to normalize or scale any of them and, if you think you should, practice applying the correct technique.
选择三个或四个变量,并决定是否需要对其中任何一个进行标准化或缩放,如果您认为需要,请练习应用正确的技术。
Keep going
继续前进
In the next lesson, learn how to parse dates in a dataset.
在下一课中,学习如何在数据集中解析日期。