Introduction
简介
You've seen (and used) techniques to extract general insights from a machine learning model. But what if you want to break down how the model works for an individual prediction?
您已经看到(并使用)了从机器学习模型中提取一般见解的技术。但是,如果您想分解模型如何针对单个预测发挥作用,该怎么办?
SHAP Values (an acronym from SHapley Additive exPlanations) break down a prediction to show the impact of each feature. Where could you use this?
SHAP 值(SHapley Additive exPlanations 的缩写)分解预测以显示每个特征的影响。您可以在哪里使用它?
- A model says a bank shouldn't loan someone money, and the bank is legally required to explain the basis for each loan rejection
- 一个模型表明银行不应该向某人贷款,并且银行在法律上有义务解释每次贷款被拒绝的依据
- A healthcare provider wants to identify what factors are driving each patient's risk of some disease so they can directly address those risk factors with targeted health interventions
- 医疗保健提供者希望确定哪些因素导致每个患者患上某种疾病的风险,以便他们可以通过有针对性的健康干预措施直接解决这些风险因素
You'll use SHAP Values to explain individual predictions in this lesson. In the next lesson, you'll see how these can be aggregated into powerful model-level insights.
您将在本课中使用 SHAP 值来解释单个预测。在下一课中,您将看到如何将这些值汇总为强大的模型级见解。
How They Work
工作原理
SHAP values interpret the impact of having a certain value for a given feature in comparison to the prediction we'd make if that feature took some baseline value.
SHAP 值解释了给定特征具有特定值的影响,与该特征采用某个基线值时我们做出的预测相比。
An example is helpful, and we'll continue the soccer/football example from the permutation importance and partial dependence plots lessons.
举个例子很有帮助,我们将继续使用 排列重要性 和 部分依赖图 课程中的足球示例。
In these tutorials, we predicted whether a team would have a player win the Man of the Match award.
在这些教程中,我们预测了一支球队是否会有一名球员赢得 最佳球员 奖。
We could ask:
- How much was a prediction driven by the fact that the team scored 3 goals?
我们可以问:
- 预测在多大程度上受到球队进了 3 个球这一事实的影响?
But it's easier to give a concrete, numeric answer if we restate this as:
- How much was a prediction driven by the fact that the team scored 3 goals, instead of some baseline number of goals.
但如果我们将其重新表述如下,则更容易给出具体的数据答案::
- 预测在多大程度上受到球队进了 3 个球这一事实的影响,而不是某个基线进球数。
Of course, each team has many features. So if we answer this question for number of goals, we could repeat the process for all other features.
当然,每支球队都有许多特征。因此,如果我们针对进球数回答这个问题,我们可以对所有其他特征重复该过程。
SHAP values do this in a way that guarantees a nice property. Specifically, you decompose a prediction with the following equation:
SHAP 值以保证良好属性的方式执行此操作。具体来说,您可以使用以下公式分解预测:
sum(SHAP values for all features) = pred_for_team - pred_for_baseline_values
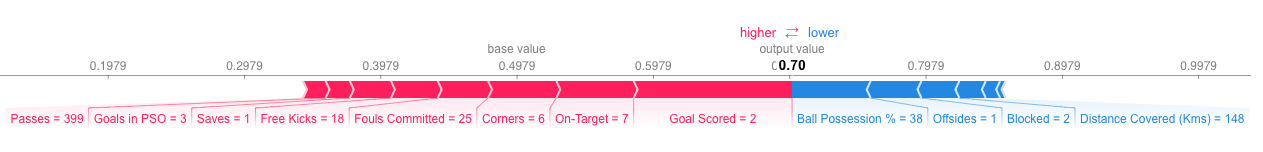
That is, the SHAP values of all features sum up to explain why my prediction was different from the baseline. This allows us to decompose a prediction in a graph like this:
也就是说,所有特征的 SHAP 值加起来可以解释为什么我的预测与基线不同。这使我们能够像这样在图中分解预测:
If you want a larger view of this graph, here is a link
如果您想要查看此图的更大视图,此处为链接
How do you interpret this?
您如何解释这一点?
We predicted 0.7, whereas the base_value is 0.4979. Feature values causing increased predictions are in pink, and their visual size shows the magnitude of the feature's effect. Feature values decreasing the prediction are in blue. The biggest impact comes from Goal Scored being 2. Though the ball possession value has a meaningful effect decreasing the prediction.
我们预测为 0.7,而 base_value 为 0.4979。导致预测增加的特征值以粉红色表示,其视觉大小显示了特征影响的大小。降低预测的特征值以蓝色表示。最大的影响来自“进球数”为 2。尽管控球值对降低预测有显著影响。
If you subtract the length of the blue bars from the length of the pink bars, it equals the distance from the base value to the output.
如果从粉红色条的长度中减去蓝色条的长度,它等于从基值到输出的距离。
There is some complexity to the technique, to ensure that the baseline plus the sum of individual effects adds up to the prediction (which isn't as straightforward as it sounds). We won't go into that detail here, since it isn't critical for using the technique. This blog post has a longer theoretical explanation.
该技术有一些复杂性,以确保基线加上各个效果的总和等于预测(这并不像听起来那么简单)。我们不会在这里详细讨论这个,因为它对于使用该技术并不重要。 这篇博文 有更长的理论解释。
Code to Calculate SHAP Values
计算 SHAP 值的代码
We calculate SHAP values using the wonderful Shap library.
我们使用出色的 Shap 库来计算 SHAP 值。
For this example, we'll reuse the model you've already seen with the Soccer data.
对于此示例,我们将重用您已在足球数据中看到的模型。
import numpy as np
import pandas as pd
from sklearn.model_selection import train_test_split
from sklearn.ensemble import RandomForestClassifier

data = pd.read_csv('../input/fifa-2018-match-statistics/FIFA 2018 Statistics.csv')
y = (data['Man of the Match'] == "Yes")  # Convert from string "Yes"/"No" to binary
feature_names = [i for i in data.columns if data[i].dtype in [np.int64, np.int64]]
X = data[feature_names]
train_X, val_X, train_y, val_y = train_test_split(X, y, random_state=1)
my_model = RandomForestClassifier(random_state=0).fit(train_X, train_y)
We will look at SHAP values for a single row of the dataset (we arbitrarily chose row 5). For context, we'll look at the raw predictions before looking at the SHAP values.
我们将查看数据集中一行的 SHAP 值(我们任意选择了第 5 行)。为了便于理解,我们将先查看原始预测,然后再查看 SHAP 值。
row_to_show = 5
data_for_prediction = val_X.iloc[row_to_show]  # use 1 row of data here. Could use multiple rows if desired
data_for_prediction_array = data_for_prediction.values.reshape(1, -1)

my_model.predict_proba(data_for_prediction_array)
/opt/conda/lib/python3.10/site-packages/sklearn/base.py:439: UserWarning: X does not have valid feature names, but RandomForestClassifier was fitted with feature names
warnings.warn(
array([[0.29, 0.71]])The team is 70% likely to have a player win the award.
该球队有 70% 的可能性让一名球员赢得该奖项。
Now, we'll move onto the code to get SHAP values for that single prediction.
现在,我们将转到代码以获取该单个预测的 SHAP 值。
import shap  # package used to calculate Shap values

# Create object that can calculate shap values
explainer = shap.TreeExplainer(my_model)

# Calculate Shap values
shap_values = explainer.shap_values(data_for_prediction)
The shap_values object above is a list with two arrays. The first array is the SHAP values for a negative outcome (don't win the award), and the second array is the list of SHAP values for the positive outcome (wins the award). We typically think about predictions in terms of the prediction of a positive outcome, so we'll pull out SHAP values for positive outcomes (pulling out shap_values[1]).
上面的 shap_values 对象是一个包含两个数组的列表。第一个数组是负面结果(未赢得奖项)的 SHAP 值,第二个数组是正面结果(赢得奖项)的 SHAP 值列表。我们通常从正面结果的预测角度来考虑预测,因此我们将提取正面结果的 SHAP 值(提取 shap_values[1])。
It's cumbersome to review raw arrays, but the shap package has a nice way to visualize the results.
查看原始数组很麻烦,但 shap 包有一种很好的方法来可视化结果。
shap.initjs()
shap.force_plot(explainer.expected_value[1], shap_values[1], data_for_prediction)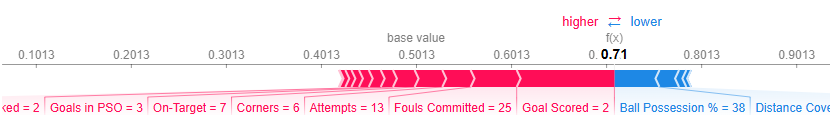
If you look carefully at the code where we created the SHAP values, you'll notice we reference Trees in shap.TreeExplainer(my_model). But the SHAP package has explainers for every type of model.
如果您仔细查看我们创建 SHAP 值的代码,您会注意到我们在 shap.TreeExplainer(my_model) 中引用了树。但 SHAP 包为每种类型的模型提供了解释器。
shap.DeepExplainerworks with Deep Learning models.shap.DeepExplainer适用于深度学习模型。shap.KernelExplainerworks with all models, though it is slower than other Explainers and it offers an approximation rather than exact Shap values.shap.KernelExplainer适用于所有模型,尽管它比其他解释器慢,并且它提供的是近似值而不是精确的 Shap 值。
Here is an example using KernelExplainer to get similar results. The results aren't identical because KernelExplainer gives an approximate result. But the results tell the same story.
这是一个使用 KernelExplainer 获得类似结果的示例。结果并不相同,因为 KernelExplainer 给出了近似结果。但结果讲述了同一个故事。
# use Kernel SHAP to explain test set predictions
k_explainer = shap.KernelExplainer(my_model.predict_proba, train_X)
k_shap_values = k_explainer.shap_values(data_for_prediction)
shap.force_plot(k_explainer.expected_value[1], k_shap_values[1], data_for_prediction)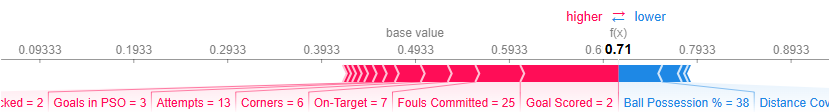
Your Turn
轮到你了
SHAP values are awesome. Have fun applying them, alongside the other tools you've learned, to solve a full data-science scenario.
SHAP 值非常棒。尽情应用它们以及你学到的其他工具来 解决完整的数据科学场景 。